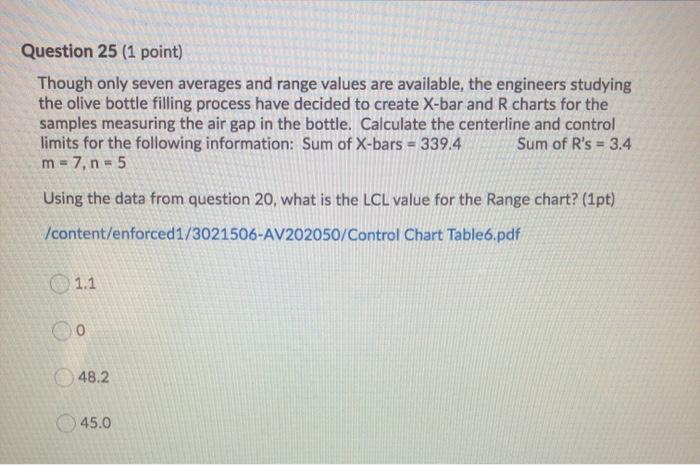
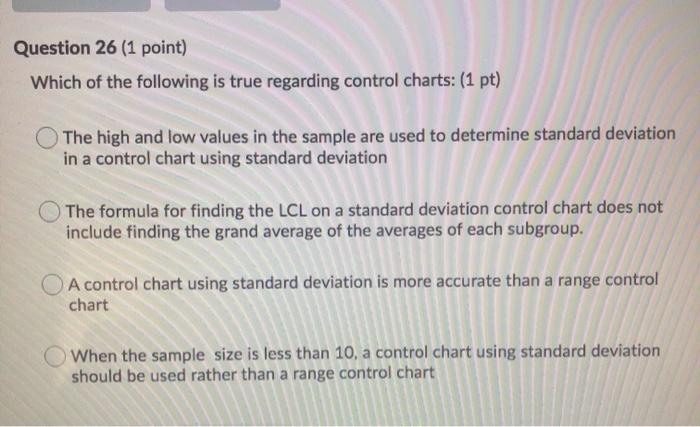
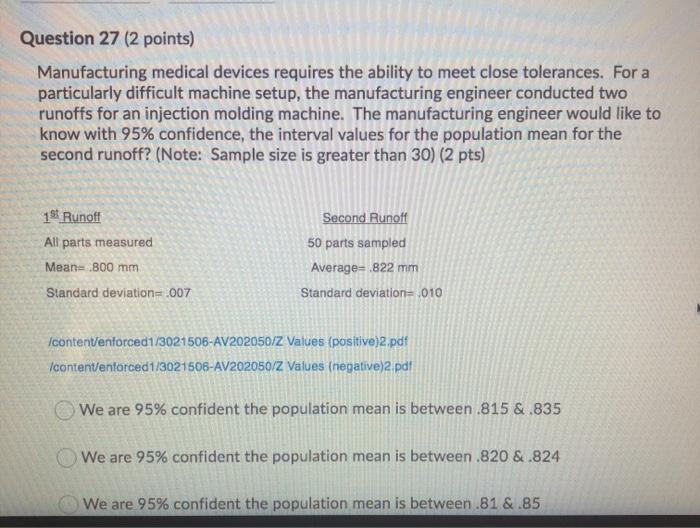
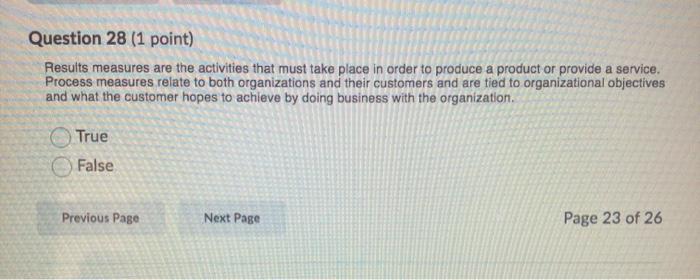
Question: Question 25 (1 point) Though only seven averages and range values are available, the engineers studying the olive bottle filling process have decided to create
Question 25 (1 point) Though only seven averages and range values are available, the engineers studying the olive bottle filling process have decided to create X-bar and R charts for the samples measuring the air gap in the bottle. Calculate the centerline and control limits for the following information: Sum of X-bars = 339.4 Sum of R's = 3.4 m = 7, n = 5 Using the data from question 20, what is the LCL value for the Range chart? (1pt) Acontent/enforced1/3021506-AV202050/Control Chart Table6.pdf 1.1 48.2 45.0 Question 26 (1 point) Which of the following is true regarding control charts: (1 pt) The high and low values in the sample are used to determine standard deviation in a control chart using standard deviation The formula for finding the LCL on a standard deviation control chart does not include finding the grand average of the averages of each subgroup. A control chart using standard deviation is more accurate than a range control chart When the sample size is less than 10, a control chart using standard deviation should be used rather than a range control chart Question 27 (2 points) Manufacturing medical devices requires the ability to meet close tolerances. For a particularly difficult machine setup, the manufacturing engineer conducted two runoffs for an injection molding machine. The manufacturing engineer would like to know with 95% confidence, the interval values for the population mean for the second runoff? (Note: Sample size is greater than 30) (2 pts) 194 Runoff All parts measured Means 800 mm Standard deviation=2007 Second Runoft 50 parts sampled Average= 822 mm Standard deviation-010 /content/enforced1/3021506-AV202050/2 Values (positive)2.pdf /content/enforced 1/3021506-AV202050/Z Values (negative)2.pdf We are 95% confident the population mean is between .815 &.835 We are 95% confident the population mean is between 820 &.824 We are 95% confident the population mean is between .81 &.85 Question 28 (1 point) Results measures are the activities that must take place in order to produce a product or provide a service. Process measures relate to both organizations and their customers and are tied to organizational objectives and what the customer hopes to achieve by doing business with the organization. True False Previous Page Next Page Page 23 of 26 Question 29 (1 point) Who coined the principle "80% of problems can be attributed to 20% of causes and encouraged management to work on "vital few" causes or root causes?" Dr, Deming Dr. Juran Dr. Shewhart Dr. Smith Previous Page Next Page Page 25 of 26 Question 30 (1 point) When deciding upon the number of observations in a process, it is always better to measure the entire population as it is most cost effective. True False Previous Page Next Page Page 26 of 26 Question 31 (1 point) Measures of dispersion, the range and standard deviation, refer to the spread of the data. The range and standard deviation enable those studying a process to understand how much variation is present in the process, True False Question 25 (1 point) Though only seven averages and range values are available, the engineers studying the olive bottle filling process have decided to create X-bar and R charts for the samples measuring the air gap in the bottle. Calculate the centerline and control limits for the following information: Sum of X-bars = 339.4 Sum of R's = 3.4 m = 7, n = 5 Using the data from question 20, what is the LCL value for the Range chart? (1pt) Acontent/enforced1/3021506-AV202050/Control Chart Table6.pdf 1.1 48.2 45.0 Question 26 (1 point) Which of the following is true regarding control charts: (1 pt) The high and low values in the sample are used to determine standard deviation in a control chart using standard deviation The formula for finding the LCL on a standard deviation control chart does not include finding the grand average of the averages of each subgroup. A control chart using standard deviation is more accurate than a range control chart When the sample size is less than 10, a control chart using standard deviation should be used rather than a range control chart Question 27 (2 points) Manufacturing medical devices requires the ability to meet close tolerances. For a particularly difficult machine setup, the manufacturing engineer conducted two runoffs for an injection molding machine. The manufacturing engineer would like to know with 95% confidence, the interval values for the population mean for the second runoff? (Note: Sample size is greater than 30) (2 pts) 194 Runoff All parts measured Means 800 mm Standard deviation=2007 Second Runoft 50 parts sampled Average= 822 mm Standard deviation-010 /content/enforced1/3021506-AV202050/2 Values (positive)2.pdf /content/enforced 1/3021506-AV202050/Z Values (negative)2.pdf We are 95% confident the population mean is between .815 &.835 We are 95% confident the population mean is between 820 &.824 We are 95% confident the population mean is between .81 &.85 Question 28 (1 point) Results measures are the activities that must take place in order to produce a product or provide a service. Process measures relate to both organizations and their customers and are tied to organizational objectives and what the customer hopes to achieve by doing business with the organization. True False Previous Page Next Page Page 23 of 26 Question 29 (1 point) Who coined the principle "80% of problems can be attributed to 20% of causes and encouraged management to work on "vital few" causes or root causes?" Dr, Deming Dr. Juran Dr. Shewhart Dr. Smith Previous Page Next Page Page 25 of 26 Question 30 (1 point) When deciding upon the number of observations in a process, it is always better to measure the entire population as it is most cost effective. True False Previous Page Next Page Page 26 of 26 Question 31 (1 point) Measures of dispersion, the range and standard deviation, refer to the spread of the data. The range and standard deviation enable those studying a process to understand how much variation is present in the process, True False