

Question: Process Analysis a)Following the guidelines provided below*, conduct a quantitative analysis of the restaurant operation to identify the bottleneck in the process and to calculate
Process Analysis
a)Following the guidelines provided below*, conduct a quantitative analysis of the restaurant operation to identify the bottleneck in the process and to calculate how long customers might have to wait to be served.
b)Explain how the unusual seating policy is an operations management tool.
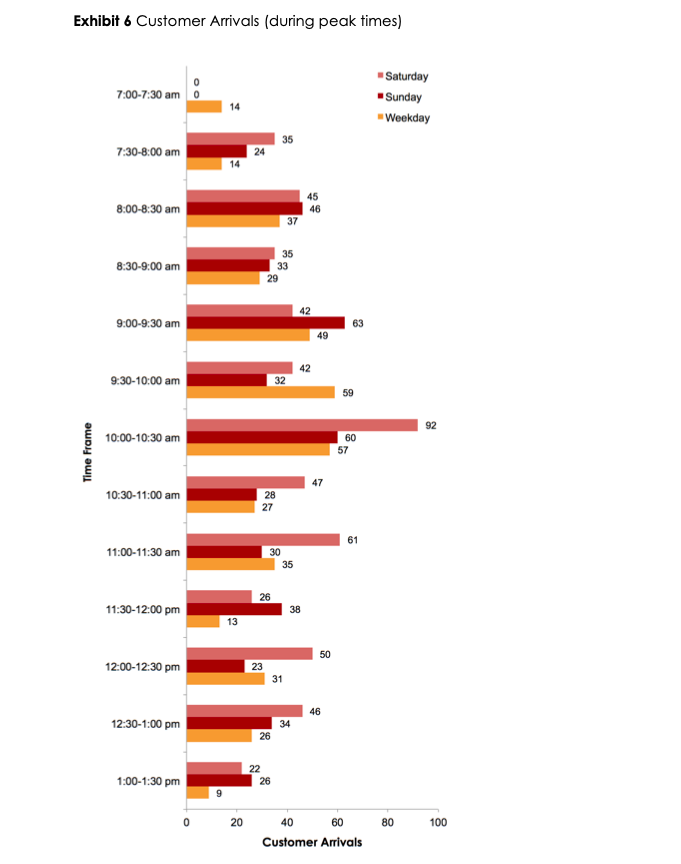
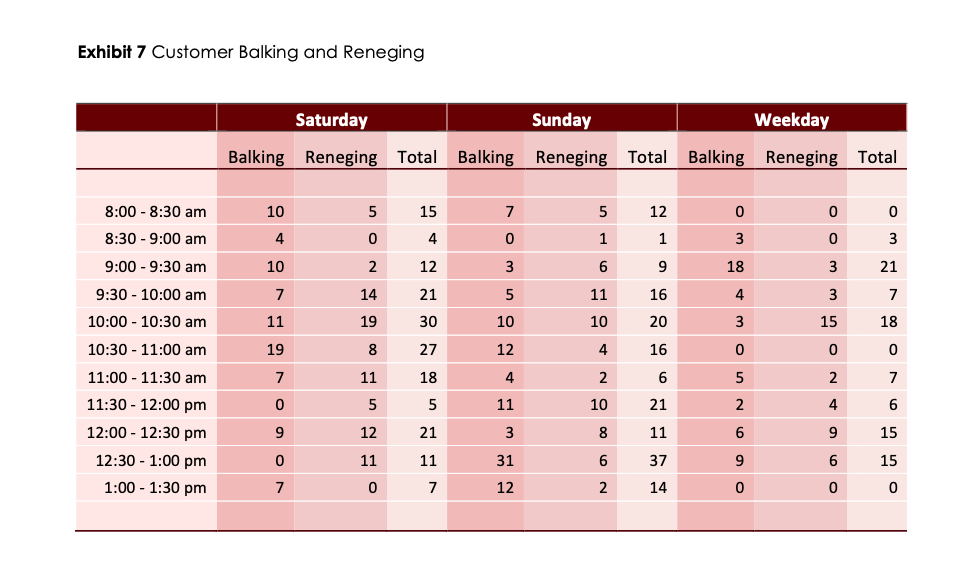
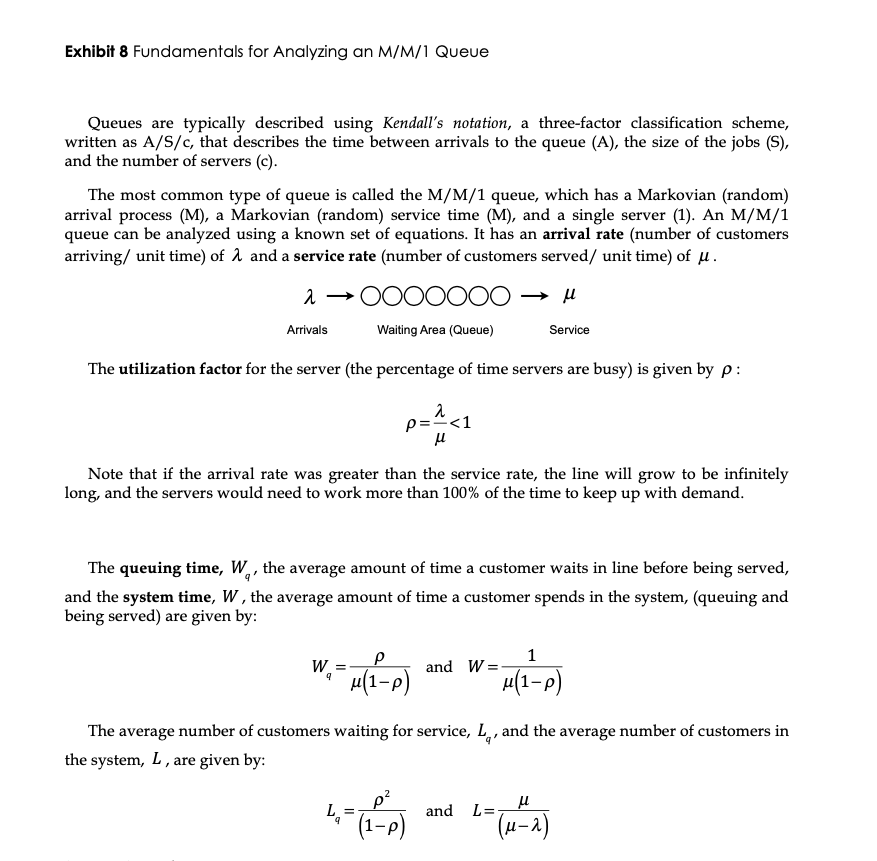
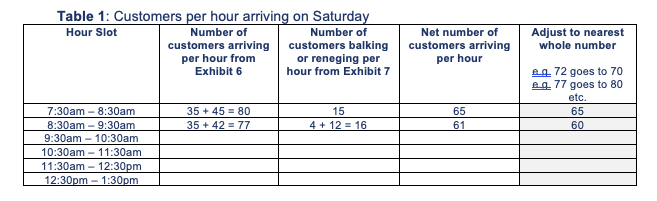
Exhibit 6 Customer Arrivals (during peak times) Saturday 0 0 7:00-7:30 am Sunday 14 -Weekday 35 7:30-8:00 am 24 14 45 8:00-8:30 am 46 37 35 8:30-9:00 am 33 29 42 9:00-9:30 am 42 9:30-10:00 am 32 59 92 10:00-10:30 am 60 57 Time Frame 47 10:30-11:00 am 28 27 61 11:00-11:30 am 30 35 26 11:30-12:00 pm 38 13 50 12:00-12:30 pm 23 31 46 12:30-1:00 pm 34 26 22 1:00-1:30 pm 26 5 0 20 40 60 80 100 Customer ArrivalsExhibit 7 Customer Balking and Reneging Saturday Sunday Weekday Balking Reneging Total Balking Reneging Total Balking Reneging Total 8:00 - 8:30 am 10 UT 15 7 5 12 0 O 8:30 - 9:00 am 4 0 4 0 1 1 3 3 9:00 - 9:30 am 10 2 12 3 6 9 18 3 21 9:30 - 10:00 am 7 14 21 5 11 16 A 7 10:00 - 10:30 am 11 19 30 10 10 20 3 15 18 10:30 - 11:00 am 19 8 27 12 4 16 0 0 0 11:00 - 11:30 am 7 11 18 4 2 6 5 N 7 11:30 - 12:00 pm 0 5 5 11 10 21 2 4 6 12:00 - 12:30 pm 9 12 21 3 8 11 6 9 15 12:30 - 1:00 pm 11 11 31 6 37 9 6 15 O 1:00 - 1:30 pm 0 7 12 2 14 0 0 0Exhibit 5 Fundamentals for Analyzing on MIMI I Queue Queues are typically described using Kendall's notation, a three-factor classication scheme, written as AIS/c, that describes the time between arrivals to the queue (A), the size of the jobs {5), and the number of servers {c} The most common type of queue is called the MfoT queue, which has a Markovian (random) arrival process (M), a Markovian (random) service time (M), and a single server {1]. An M/M/l queue can be analyzed using a known set of equations. It has an arrival rate (number of customers arriving} unit time) of .1 and a service rate {number of customers servedf unit time) of u . 2, #0000000 - Arrivals Waiting Area {Queue} Service The utilization factor for the server (the percentage of time servers are busy) is given by p : p=
Step by Step Solution
There are 3 Steps involved in it

Get step-by-step solutions from verified subject matter experts