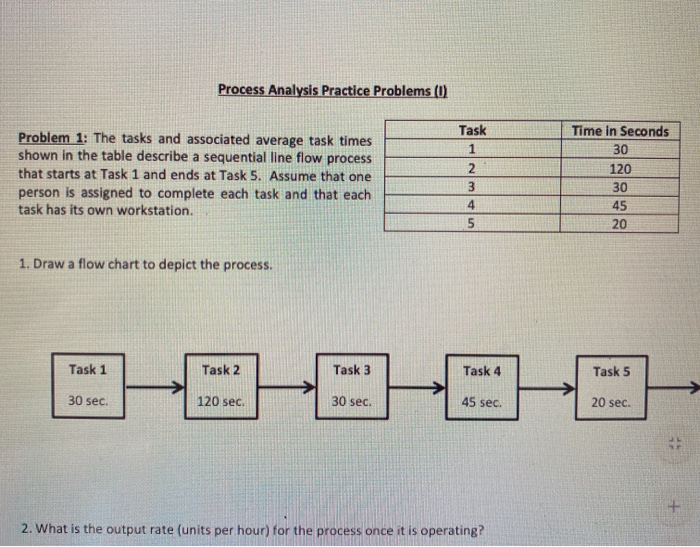
Question: Process Analysis Practice Problems (0) Problem 1: The tasks and associated average task times shown in the table describe a sequential line flow process that

Process Analysis Practice Problems (0) Problem 1:
Process Analysis Practice Problems (0) Problem 1: The tasks and associated average task times shown in the table describe a sequential line flow process that starts at Task 1 and ends at Task 5. Assume that one person is assigned to complete each task and that each task has its own workstation. Task 1 2 3 4 5 Time In Seconds 30 120 30 45 20 1. Draw a flow chart to depict the process. Task 1 Task 2 Task 3 Task 4 Task 5 H 30 sec. 120 sec 30 sec. 45 sec. 20 sec. 2. What is the output rate (units per hour) for the process once it is operating

Step by Step Solution

There are 3 Steps involved in it

1 Expert Approved Answer
Step: 1 Unlock blur-text-image
Question Has Been Solved by an Expert!

Get step-by-step solutions from verified subject matter experts

Step: 2 Unlock
Step: 3 Unlock

Students Have Also Explored These Related General Management Questions!