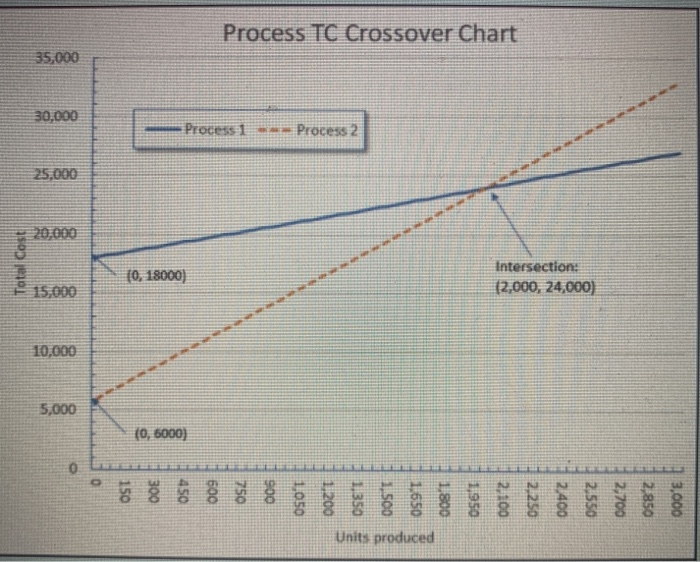
Question: Process TC Crossover Chart SO2000 Process Process 2 20.000 10, 18000) Intersection 12,000, 24,000) 15.00 10,000 5,000 (0, 6000) 500 750 900 1,050 1.200 008

Process TC Crossover Chart SO2000 Process Process
Process TC Crossover Chart SO2000 Process Process 2 20.000 10, 18000) Intersection 12,000, 24,000) 15.00 10,000 5,000 (0, 6000) 500 750 900 1,050 1.200 008 TE OS6' 2.100 2.250 2.400 2,550 2,700 2,850 Units produced The crossover point (x,y) is Choose... - The y-intercept of Process 1 is Choose... - The y-intercept of Process 2 is Choose... At an output level of 1,000 units, which process has higher TC? Choose... At an output level of 3,000 units, which process has higher TC? Choose... - Which process is best (lower cost) at an output level of x=1999? Choose... Which process has a larger/steeper v?! Choose... Which process has higher fixed costs? Choose... - What is the TC for Process 1 at an output level of 2000 units? Choose... - What is the output level when Process 2 TC = 24000? Choose... - What is the TC for Process 2 at an output level of 2000 units? Choose... . What is the output level when Process 1 TC = 24000? Choose

Step by Step Solution

There are 3 Steps involved in it

1 Expert Approved Answer
Step: 1 Unlock blur-text-image
Question Has Been Solved by an Expert!

Get step-by-step solutions from verified subject matter experts

Step: 2 Unlock
Step: 3 Unlock

Students Have Also Explored These Related General Management Questions!