

Question: Process time at a workstation is monitored using sample mean and range control charts. Six samples of n=15 observations have been obtained and the sample
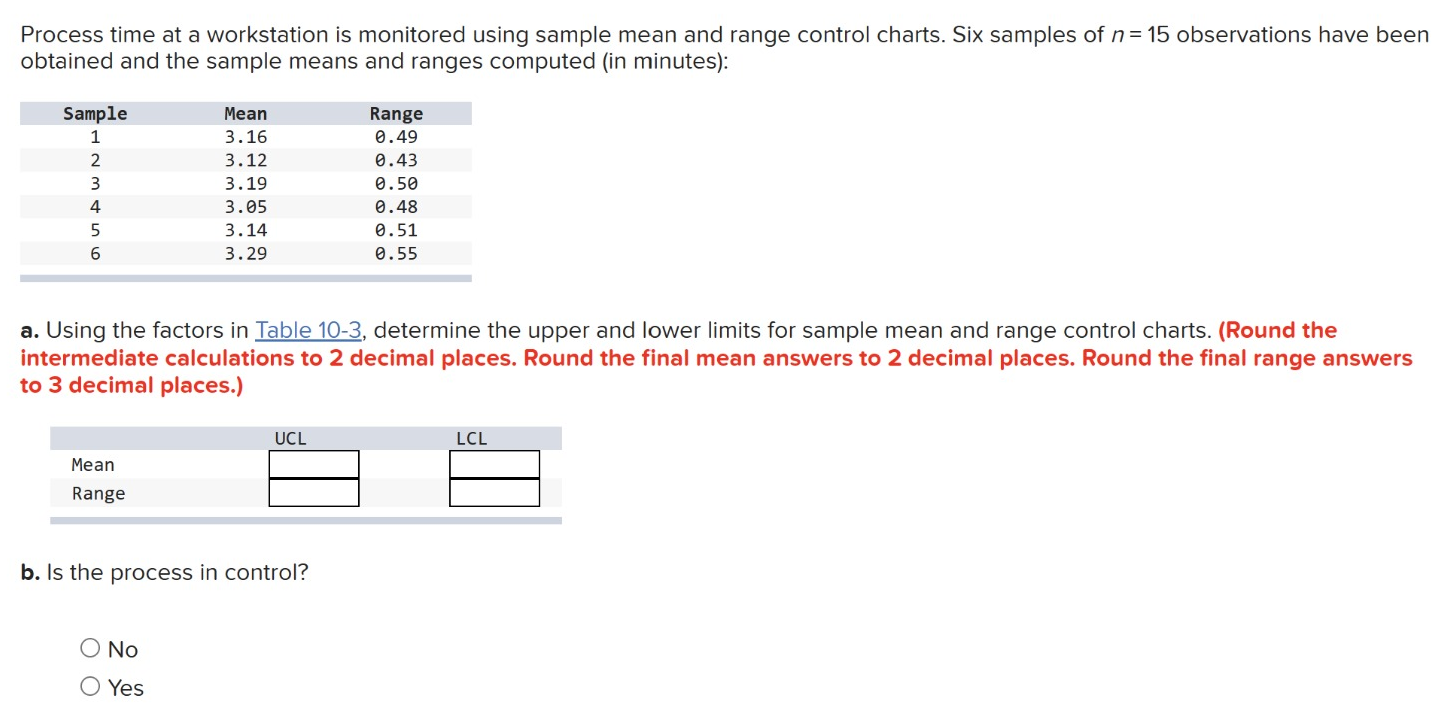
Process time at a workstation is monitored using sample mean and range control charts. Six samples of n=15 observations have been obtained and the sample means and ranges computed (in minutes): a. Using the factors in Table 10-3, determine the upper and lower limits for sample mean and range control charts. (Round the intermediate calculations to 2 decimal places. Round the final mean answers to 2 decimal places. Round the final range answers to 3 decimal places.) b. Is the process in control? No Yes
Step by Step Solution
There are 3 Steps involved in it
1 Expert Approved Answer
Step: 1 Unlock

Question Has Been Solved by an Expert!
Get step-by-step solutions from verified subject matter experts
Step: 2 Unlock
Step: 3 Unlock