

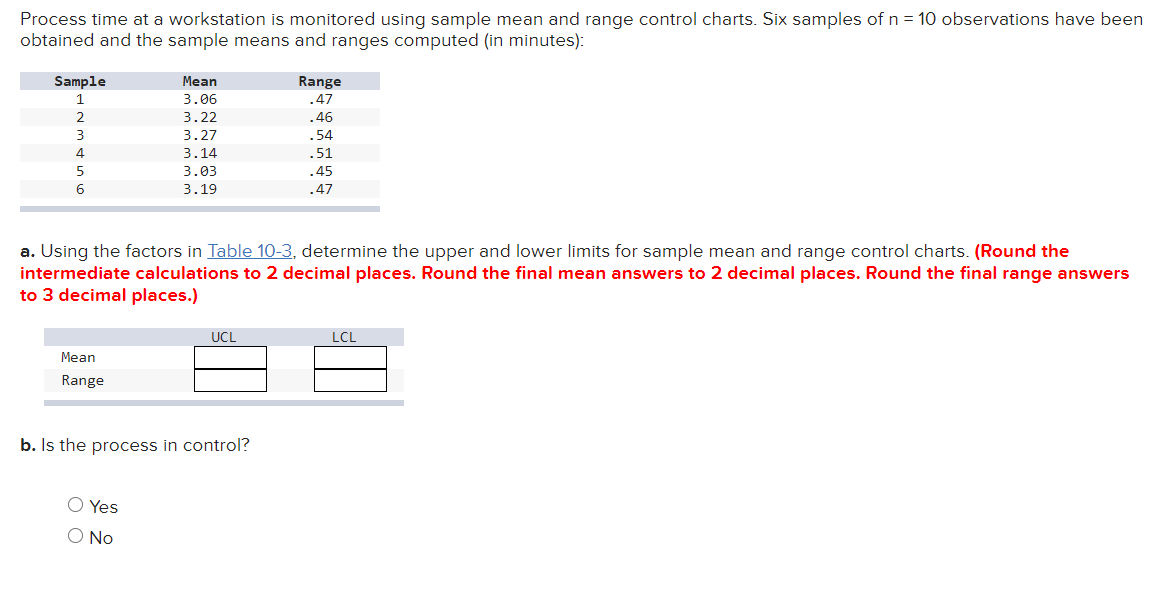
Question: second picture is the Table 10.3 to be used for the question Process time at a workstation is monitored using sample mean and range control
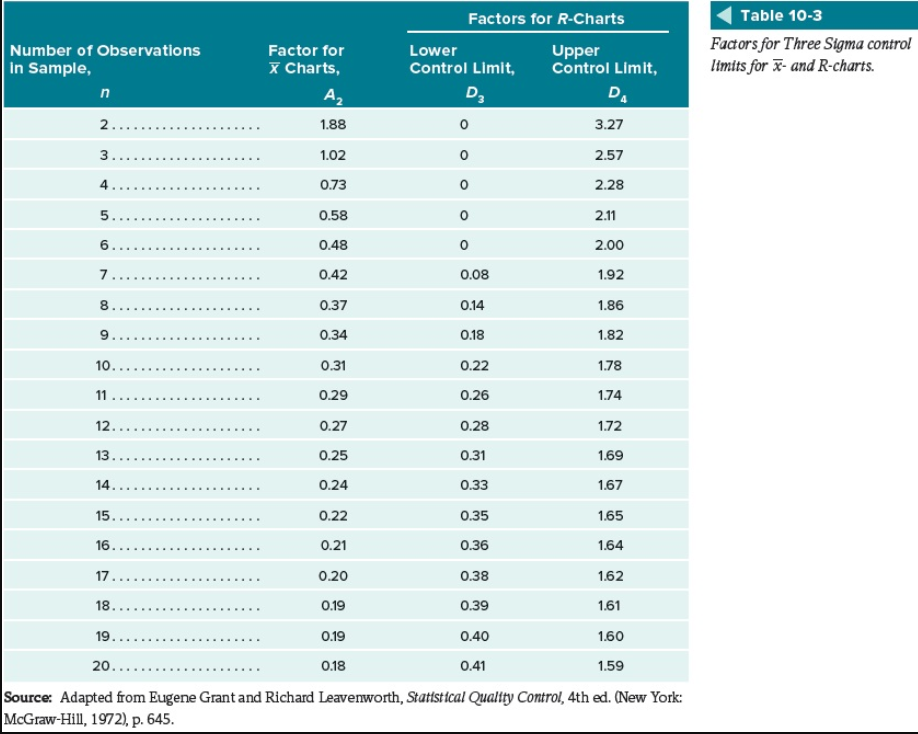 second picture is the Table 10.3 to be used for the question
Step by Step Solution
There are 3 Steps involved in it
1 Expert Approved Answer
Step: 1 Unlock

Question Has Been Solved by an Expert!
Get step-by-step solutions from verified subject matter experts
Step: 2 Unlock
Step: 3 Unlock