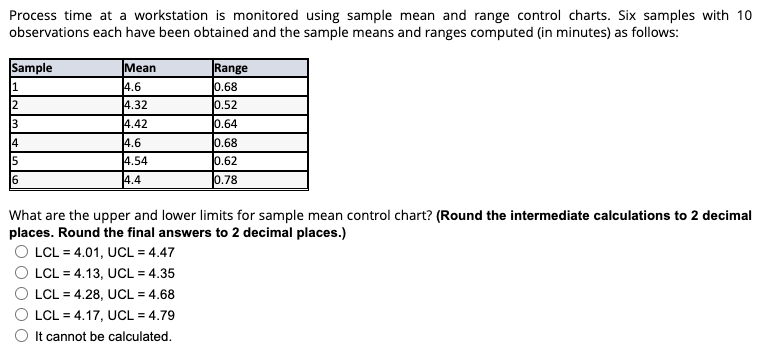
Question: Process time at a workstation is monitored using sample mean and range control charts. Six samples with 10 observations each have been obtained and the

Process time at a workstation is monitored using

Process time at a workstation is monitored using sample mean and range control charts. Six samples with 10 observations each have been obtained and the sample means and ranges computed (in minutes) as follows: What are the upper and lower limits for sample mean control chart? (Round the intermediate calculations to 2 decimal places. Round the final answers to 2 decimal places.) LCL=4.01,UCL=4.47LCL=4.13,UCL=4.35LCL=4.28,UCL=4.68LCL=4.17,UCL=4.79 It cannot be calculated

Step by Step Solution

There are 3 Steps involved in it

1 Expert Approved Answer
Step: 1 Unlock blur-text-image
Question Has Been Solved by an Expert!

Get step-by-step solutions from verified subject matter experts

Step: 2 Unlock
Step: 3 Unlock

Students Have Also Explored These Related General Management Questions!