

Question: Professional Development Opportunities: Desirability Survey AnalysisData Sources Three data sources were considered for this presentation: 1. Employee survey to determine desirability of professional development 2.


![SCORES DESIRABILITY SCORES BY 3'\" GROUP 5 U Employee Manager [12. 23.6]](https://s3.amazonaws.com/si.experts.images/answers/2024/06/6673a4b9856d0_8416673a4b96ee97.jpg)
![[23.6. 35.2] [35.2, 46.3] {46.3, 53.4] [53.4. I'D] Visual Representation: Cost PROFESSIONAL](https://s3.amazonaws.com/si.experts.images/answers/2024/06/6673a4b9c9ca5_8416673a4b9b77d8.jpg)
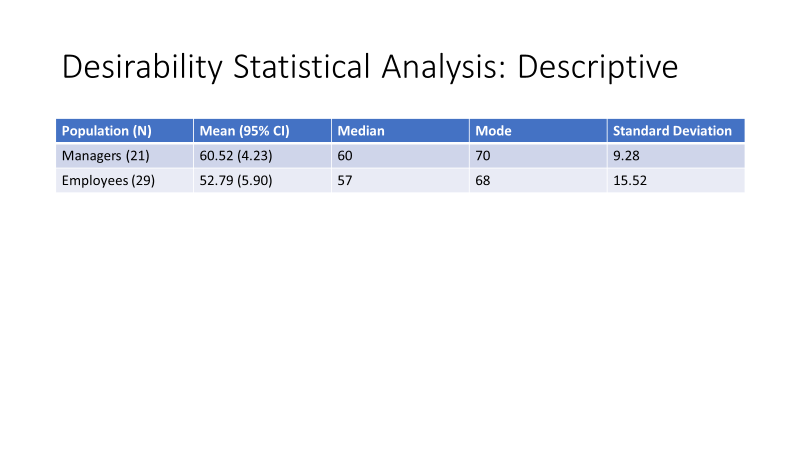
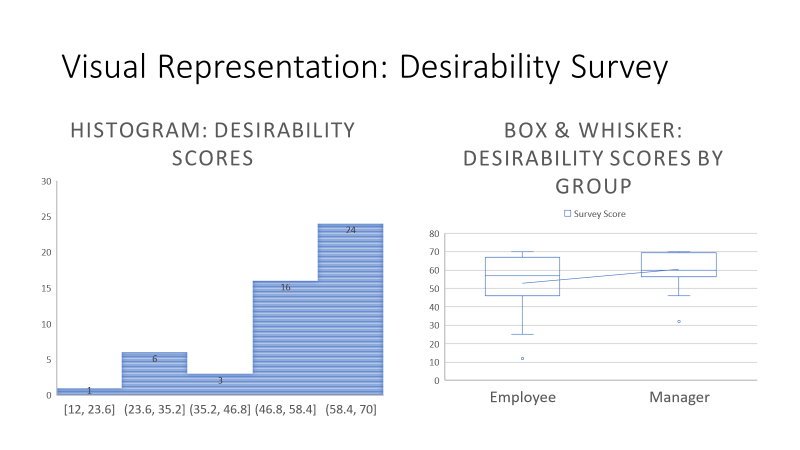
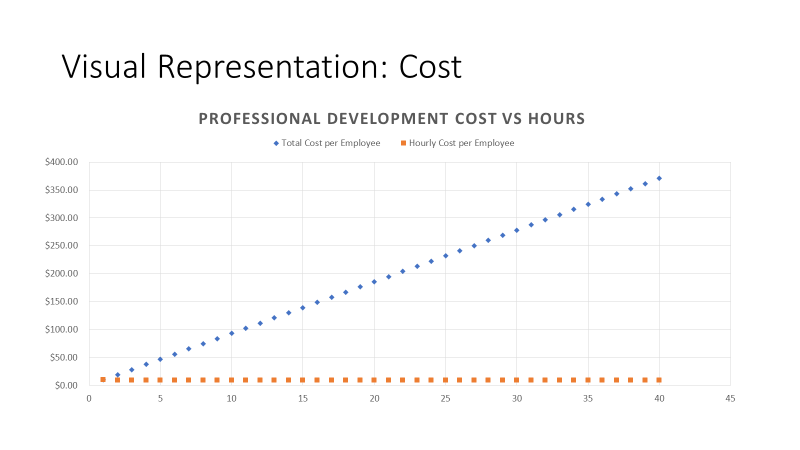
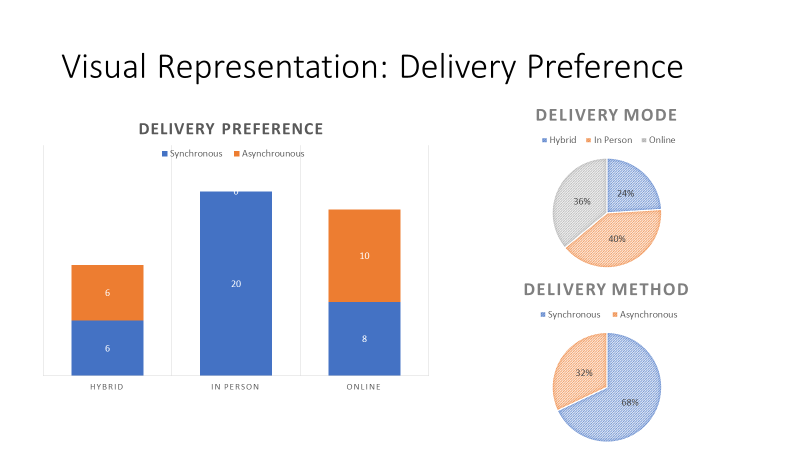
Professional Development Opportunities: Desirability Survey AnalysisData Sources Three data sources were considered for this presentation: 1. Employee survey to determine desirability of professional development 2. Cost of professional development per employee for various lengths 3. Employee survey to determine professional development delivery preference Data: Desirability Survey . Either ordinal data (item level) or interval data (total) . Survey deployed to 50 participants . Score determined by totaling 10 item scores on survey . For each item, participants could add between 1 and 7 points to their score total (ranging from Strongly Disagree to Strongly Agree) . Maximum score: 70; minimum score: 10 . Higher scores suggest professional development is more desiredData: Professional Development Cost Ratio data Costs collected from vendor for hourly rate per employee ' Collected multiple rates for varying total hours of professional development Data: Delivery Preference Survey . Nominal or categorical data . Surveyed 50 participants (managers and employees) . Asked for mode of delivery: online, in person, or hybrid . Asked for method of delivery: synchronous or asynchronousVisual Representation: Desirability Survey HISTOGRAM: DESIRABILITY BOX& WHISKER: SCORES DESIRABILITY SCORES BY 3'\" GROUP 5 U Employee Manager [12. 23.6] [23.6. 35.2] [35.2, 46.3] {46.3, 53.4] [53.4. I'D] Visual Representation: Cost PROFESSIONAL DEVELOPMENT COST VS HOURS * Total Cost per Employee Hourly Cost per Employee 5400.00 $350.00 5300.00 $250.00 $200.00 $150.00 $100.00 $50.00 $0.00 5 10 15 20 25 3.0 35 40 45Visual Representation: Delivery Preference DELIVERY MODE DELIVERY PREFERENCE Hybrid . In Person . Online Synchronous Asynchrounous 36% 10 6 DELIVERY METHOD Synchronous Asynchronous 8 329% HYBRID IN PERSON ONLINE 68%
Step by Step Solution
There are 3 Steps involved in it

Get step-by-step solutions from verified subject matter experts