

Question: Profitability Ratio What is the operating margin for each year? Interactive Analyst Center Income Statement () FY 18 12/31/2018 32,765 FY 19 12/31/2019 FY 20
Profitability Ratio
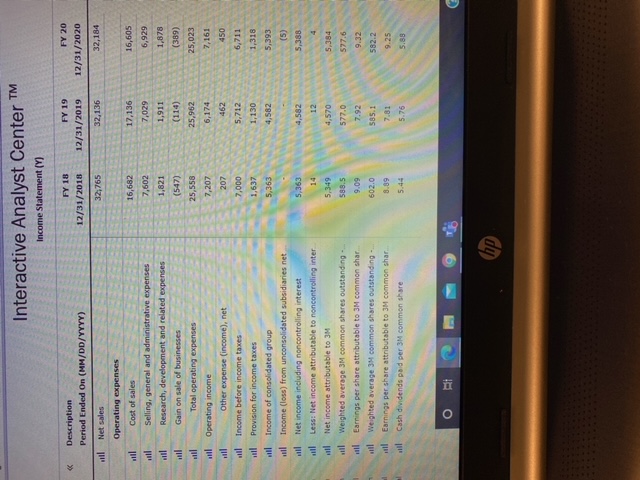
What is the operating margin for each year?
Interactive Analyst Center Income Statement () FY 18 12/31/2018 32,765 FY 19 12/31/2019 FY 20 12/31/2020 32,136 32,184 16,682 7,602 1,821 (547) 25,558 7,207 17,136 7,029 1,911 (114) 25,962 6,174 16,605 6,929 1,878 (389) 25,023 7,161 il 207 450 Description Period Ended On (MM/DD/YYYY) will Net sales Operating expenses will Cost of sales Selling, general and administrative expenses ul Research, development and related expenses will Gain on sale of businesses wil Total operating expenses sil Operating income Other expense (income), net il Income before income taxes il Provision for income taxes Income of consolidated group ill Income (loss) from unconsolidated subsidiaries net il Net income including non controlling interest will Less: Net income attributable to noncontrolling inter all Net income attributable to 3M l Weighted average 3M common shares outstanding all Earnings per share attributable to 3M common shar will Weighted average 3M common shares outstanding - il Earnings per share attributable to 3M common shar sil Cash dividends paid per 3M common share 5,712 7,000 1,637 5,363 1,130 6,711 1,318 5,393 4,582 (5) 5,388 5,363 4,582 12 4 5,384 5,349 588.5 4,570 577.0 577.6 9.32 9.09 582.2 602.0 8.89 5.44 7.92 585.1 7.81 5.76 9.25 5.88 6 hp
Step by Step Solution
There are 3 Steps involved in it

Get step-by-step solutions from verified subject matter experts