

Question: Program in C language. Objectives Write a program that allows a user to choose a function and plots a primitive graph of that function. Input
Program in C language.
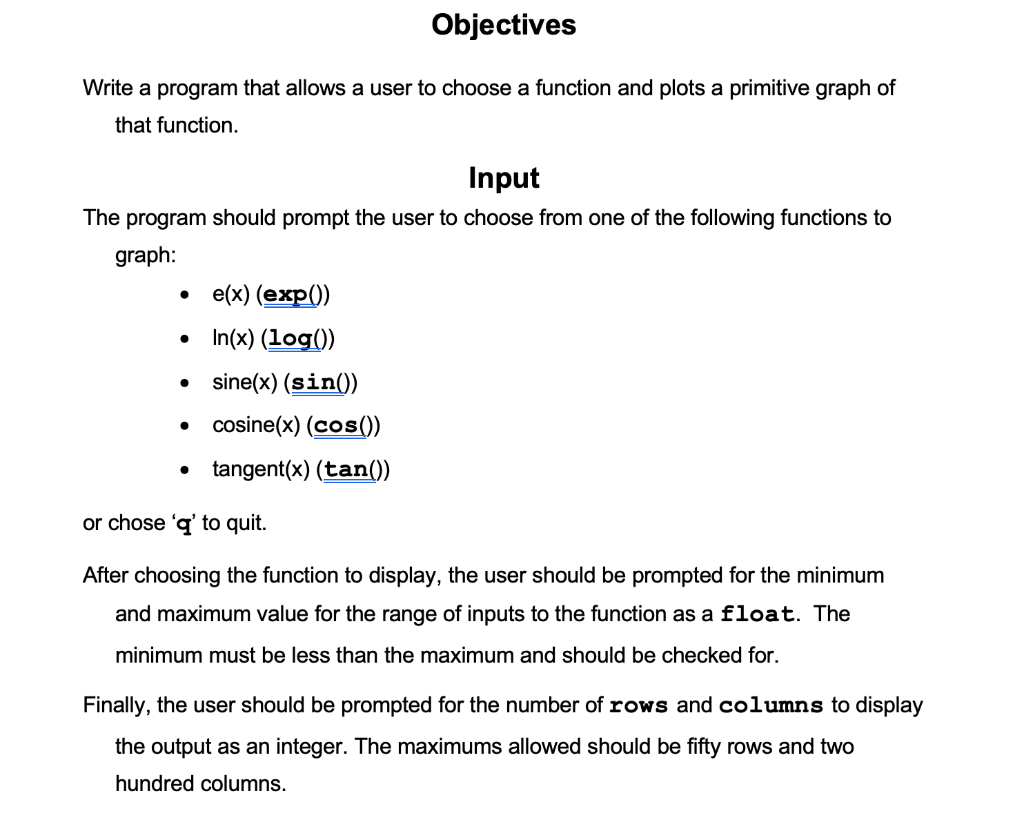
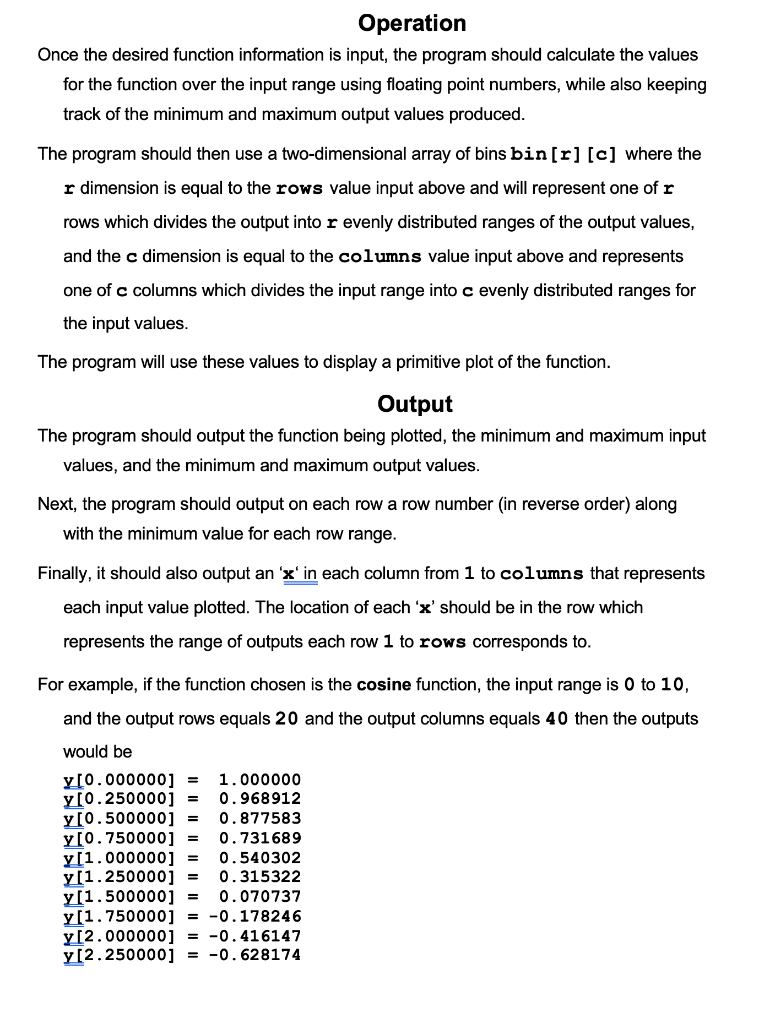
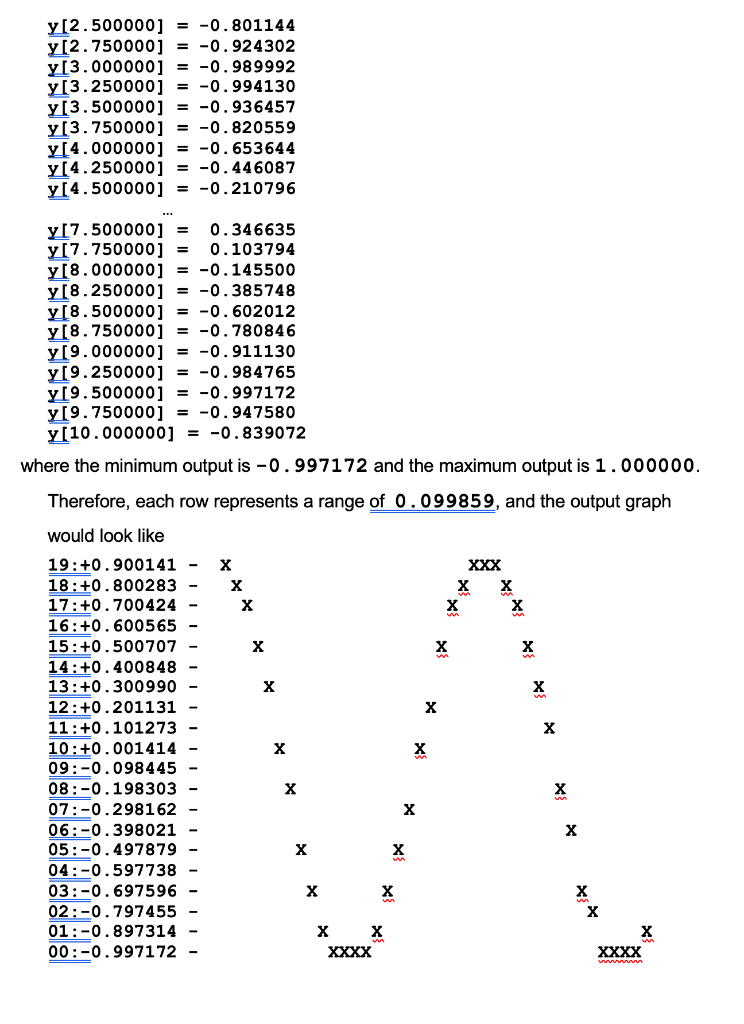
Objectives Write a program that allows a user to choose a function and plots a primitive graph of that function. Input The program should prompt the user to choose from one of the following functions to graph: e(x) (exp()) In(x) (log()) sine(x) (sin()) cosine(x) (cos()) tangent(x) (tan()) or chose 'q' to quit. After choosing the function to display, the user should be prompted for the minimum and maximum value for the range of inputs to the function as a float. The minimum must be less than the maximum and should be checked for. Finally, the user should be prompted for the number of rows and columns to display the output as an integer. The maximums allowed should be fifty rows and two hundred columns. Operation Once the desired function information is input, the program should calculate the values for the function over the input range using floating point numbers, while also keeping track of the minimum and maximum output values produced. The program should then use a two-dimensional array of bins bin[r][c] where the r dimension is equal to the rows value input above and will represent one of r rows which divides the output into r evenly distributed ranges of the output values, and the c dimension is equal to the columns value input above and represents one of c columns which divides the input range into c evenly distributed ranges for the input values. The program will use these values to display a primitive plot of the function. Output The program should output the function being plotted, the minimum and maximum input values, and the minimum and maximum output values. Next, the program should output on each row a row number in reverse order) along with the minimum value for each row range. Finally, it should also output an 'x' in each column from 1 to columns that represents each input value plotted. The location of each 'X' should be in the row which represents the range of outputs each row 1 to rows corresponds to. For example, if the function chosen is the cosine function, the input range is 0 to 10, and the output rows equals 20 and the output columns equals 40 then the outputs would be y[0.000000] 1.000000 y[0.250000] 0.968912 Y[0.500000] 0.877583 Y[0.750000] = 0.731689 y[1.000000] = 0.540302 y[1.250000] 0.315322 y[1.500000] 0.070737 y[1.750000] = -0.178246 y[2.000000] -0.416147 y[2.250000] -0.628174 II III III y[2.500000] = -0.801144 y[2.750000] = -0.924302 y[3.000000] = -0.989992 y[3.250000] = -0.994130 y[3.500000] = -0.936457 y[3.750000] = -0.820559 y[4.000000] = -0.653644 y[4.250000] = -0.446087 y[4.500000] = -0.210796 XXX y[7.500000] = 0.346635 y[7.750000] 0.103794 y[8.000000) = -0.145500 y[8.250000] = -0.385748 y[8.500000] = -0.602012 y[8.750000] = -0.780846 y[9.000000) = -0.911130 y[9.250000] = -0.984765 y[9.500000] = -0.997172 y[9.750000] = -0.947580 y[10.000000] = -0.839072 where the minimum output is -0.997172 and the maximum output is 1.000000. Therefore, each row represents a range of 0.099859, and the output graph would look like 19:+0.900141 18: +0.800283 X X 17:+0.700424 16:+0.600565 15:+0.500707 X X 14:+0.400848 13:+0.300990 X 12:+0.201131 11:+0.101273 X 10:+0.001414 X 09:-0.098445 08:-0.198303 07:-0.298162 X 06:-0.398021 05:-0.497879 X 04:-0.597738 03:-0.697596 X 02:-0.797455 X 01:-0.897314 X 00:-0.997172 XXXX XXXX www 4 of 4 The program should loop continuously asking the user to choose a function, range values, and display columns and rows until a 'q' is entered upon which the program terminates. Creation Use the following line to compile your program: gec p1.c -o pl -Wall -g - lm The code you submit must compile using the -Wall flag and should have no compiler errors or warnings
Step by Step Solution
There are 3 Steps involved in it

Get step-by-step solutions from verified subject matter experts