

Question: Project Brief System performance ( 3 0 % ) Figure Q 1 . 1 shows a section of a road network in a major city
Project Brief
System performance
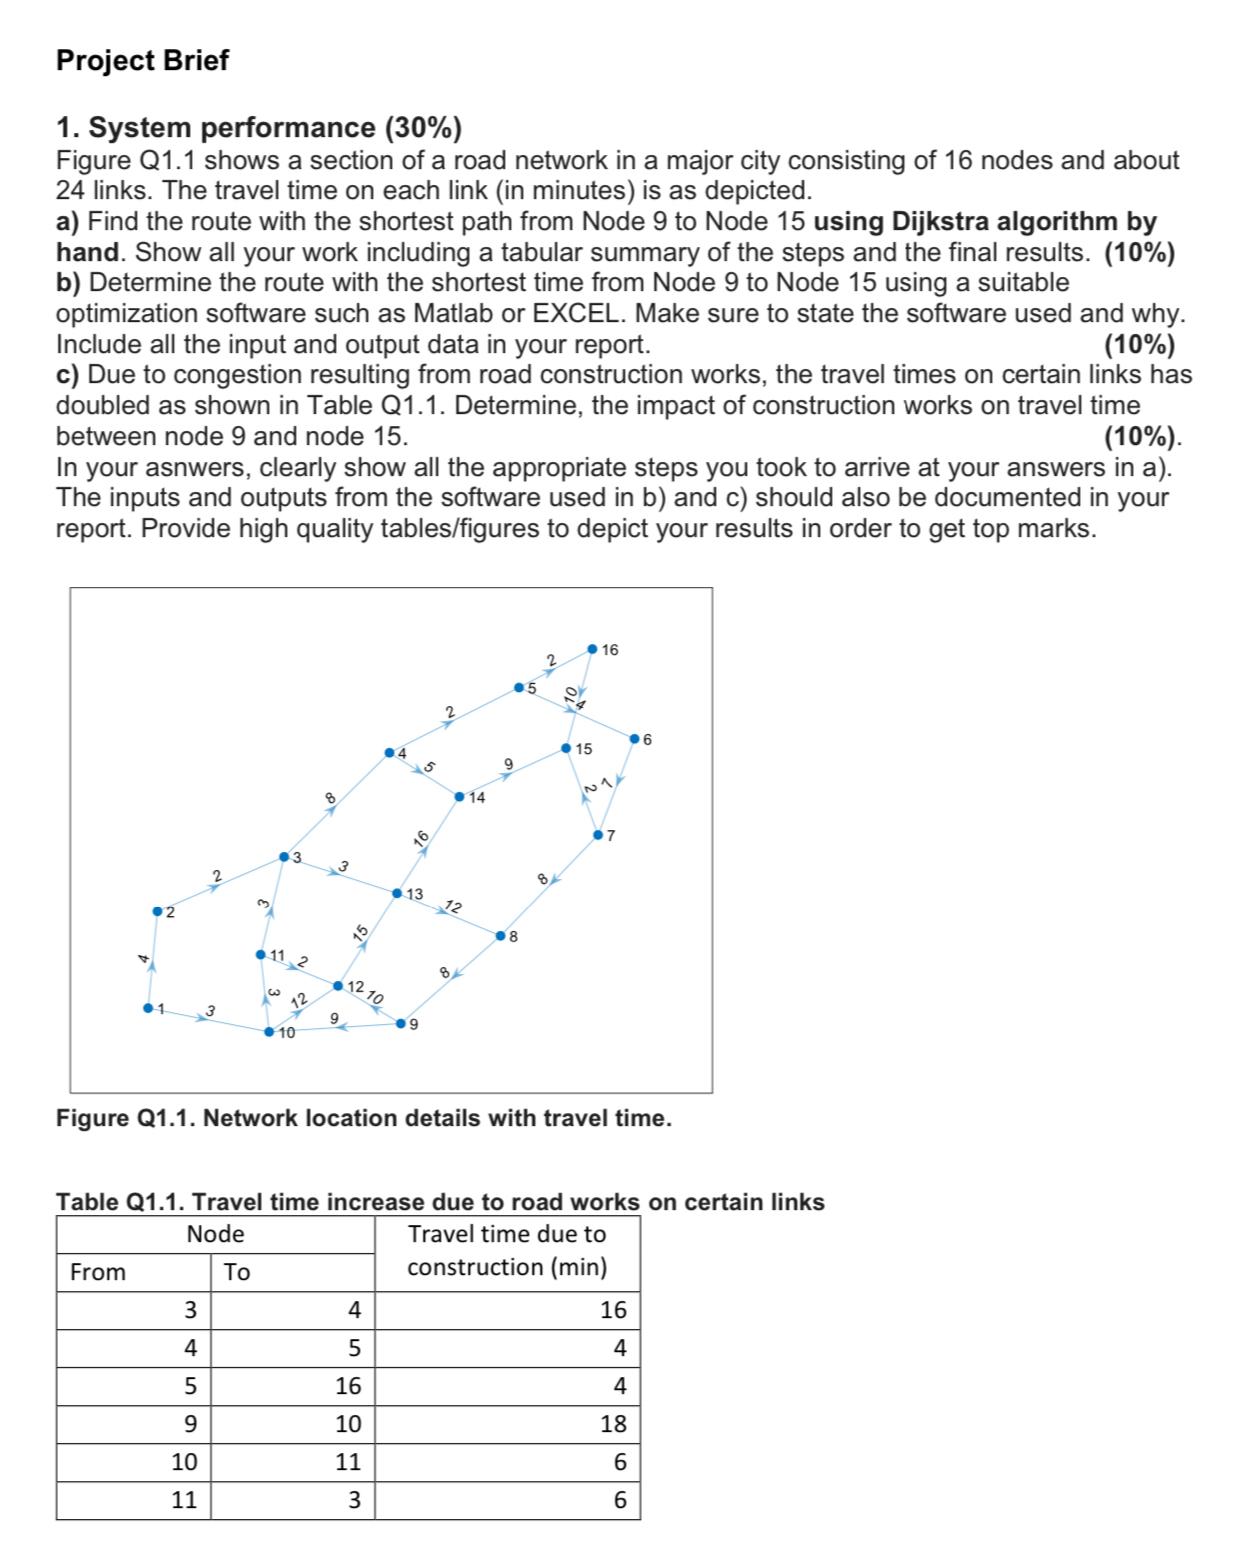
Figure Q shows a section of a road network in a major city consisting of nodes and about links. The travel time on each link in minutes is as depicted.
a Find the route with the shortest path from Node to Node using Dijkstra algorithm by hand. Show all your work including a tabular summary of the steps and the final results. b Determine the route with the shortest time from Node to Node using a suitable optimization software such as Matlab or EXCEL. Make sure to state the software used and why. Include all the input and output data in your report.
c Due to congestion resulting from road construction works, the travel times on certain links has doubled as shown in Table Q Determine, the impact of construction works on travel time between node and node
In your asnwers, clearly show all the appropriate steps you took to arrive at your answers in a The inputs and outputs from the software used in b and c should also be documented in your report. Provide high quality tablesfigures to depict your results in order to get top marks.
Figure Q Network location details with travel time.
Table Q Travel time increase due to road works on certain links
tableNodeTravel time due toFromToconstruction min
Step by Step Solution
There are 3 Steps involved in it
1 Expert Approved Answer
Step: 1 Unlock

Question Has Been Solved by an Expert!
Get step-by-step solutions from verified subject matter experts
Step: 2 Unlock
Step: 3 Unlock