Question: Project X Determine the (a) estimated-at-completion or EAC, (b) estimated-time-to-complete or ETC, and (c) discuss the Project X execution of the project, i.e., what is
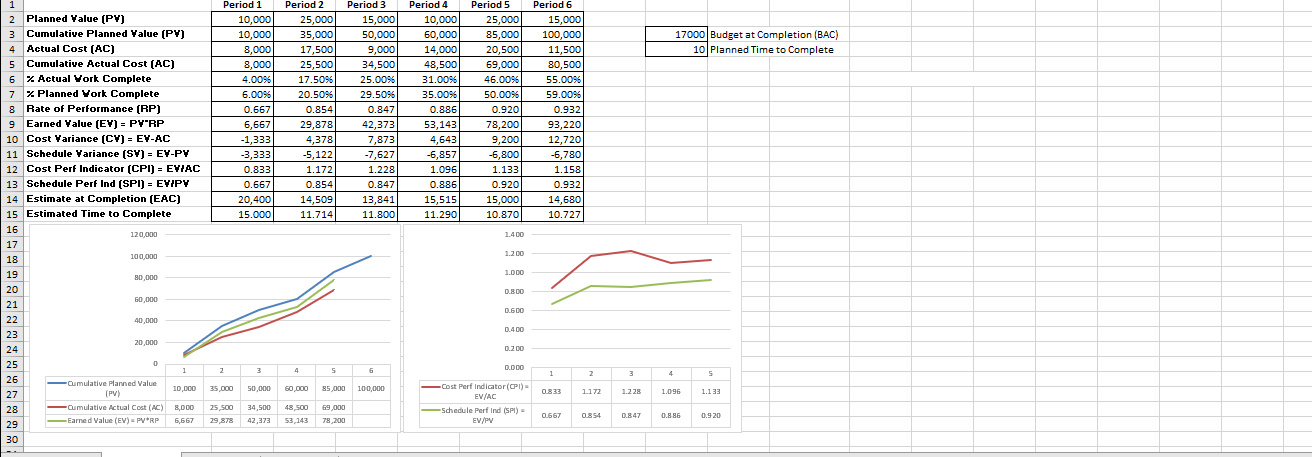
Project X
Determine the (a) estimated-at-completion or EAC, (b) estimated-time-to-complete or ETC, and (c) discuss the Project X execution of the project, i.e., what is happening.
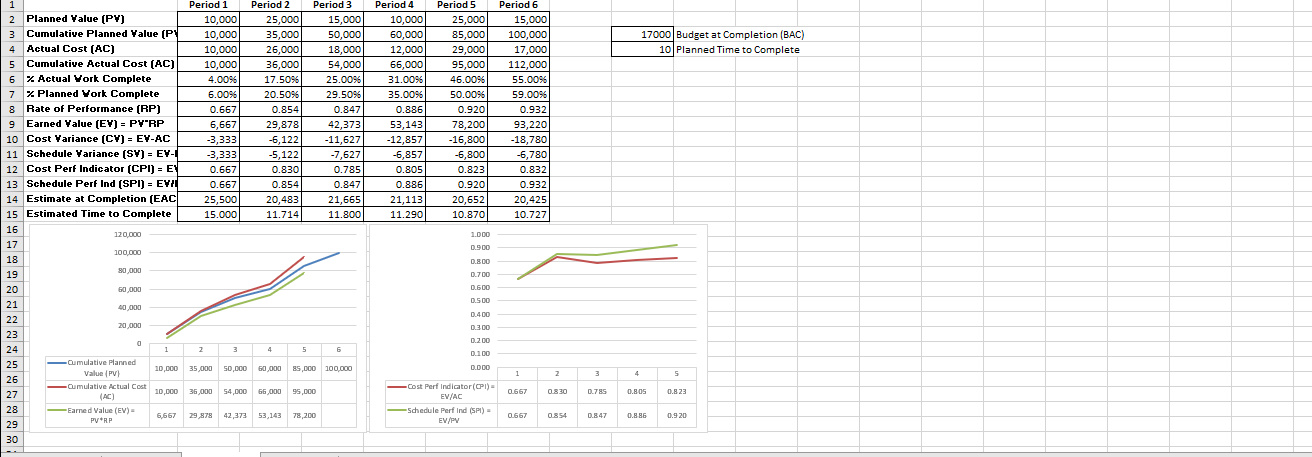
Project Y
Determine the (a) estimated-at-completion or EAC, (b) estimated-time-to-complete or ETC, and (c) discuss the Project X execution of the project, i.e., what is happening.
Project Z
Determine the (a) estimated-at-completion or EAC, (b) estimated-time-to-complete or ETC, and (c) discuss the Project X execution of the project, i.e., what is happening.
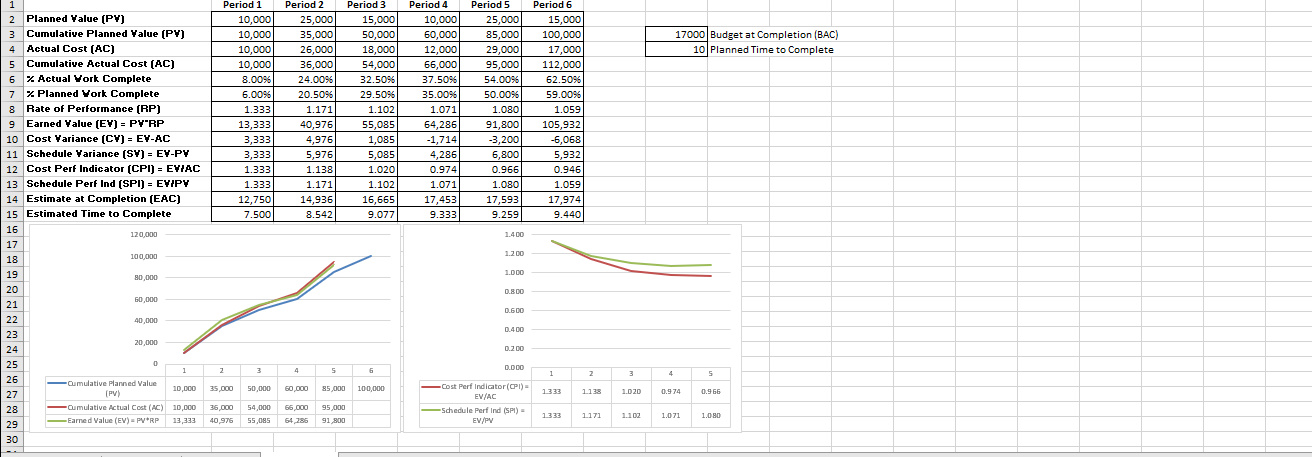
17000 Budget at Completion (BAC) 10 Planned Time to Complete 2 Planned Value (PY) 3 Cumulative Planned Value (PV) 4 Actual Cost (AC) 5 Cumulative Actual Cost (AC) 6 7 Actual York Complete 7 Z Planned York Complete 8 Rate of Performance (RP) 9 Earned Value (EY) = PY'RP 10 Cost Variance (CY) = EY-AC 11 Schedule Variance (SY) = EY-PY 12 Cost Perf Indicator (CPI) - EVIAC 13 Schedule Perf Ind (SPI) = EY/PY 14 Estimate at Completion (EAC) Estimated Time to Complete Period 1 10,000 10,000 8,000 8,000 4.0096 6.0098 0.667 6,667 -1,333 -3,333 0.833 0.667 20,400 15.000 Period 2 25,000 35,000 17,500 25,500 17.5096 20.5096 0.854 29,878 4,378 -5,122 1.172|| 0.854 14,509 11.714 Period 3 15,000 50,000 9,000 34,500 25.0096 29.50% 0.847 42,373 7,873 -7,627 1.228 0.847 13,841 11.800 Period 4 10,000 60,000 14,000 48,500 31.0096 35.00% 0.886 53,143 4,643 -6,857 1.096 0.886 15,515| 11.290 Period 5 25,000 85,000 20,500 69,000 4 6.00% 50.00% 0.920 78,200 9,200 -6,800 1.133 0.920 15,000 10.870 Period 6 15,000 100,000 11,500 80,500 55.0096 59.00% 0.932 93,220 12,720 -6,780| 1.158 0.932 14,680 10.727 120,000 1.400 100,000 1.200 1000 80,000 0.800 60,000 0.600 40,000 0.400 20,000 0.200 D.DDD 10,000 35 000 50.000 60.000 85.000 100,000 0.833 1172 -Cumulative Planned Value (PV) -Cumulative Actual Cost (AC) -Eamed Value (EV)=PV*RP Cost Perf indicator(CPI) EV/AC Schedule Perfind (SPI) - EV/PV 8,000 6,667 25,500 29,878 34,500 42,373 48,500 53,143 69,000 78,200 17000 Budget at Completion (BAC) 10 Planned Time to Complete 2 Planned Value (PY) 3 Cumulative Planned Value (PY 4 Actual Cost (AC) 5 Cumulative Actual Cost (AC) 6 Actual Vork Complete 7 Z Planned York Complete 8 Rate of Performance (RP) 19 Earned Value (EY) = PY"RP 10 Cost Variance (CY) = EY-AC 11 Schedule Variance (SV) - EVL 12 Cost Perf Indicator (CPI) - EY 13 Schedule Perf Ind (SPI) = EYLI 14 Estimate at Completion (EAC Estimated Time to Complete Period 1 10,000 10,000 10,000 10,000 4.0096 6.00% 0.667 6,6671 -3,333 3,333 0.667 0.667 25,500 15.000 Period 2 25,000 35,000 26,000 36,000 17.5096 20.5095 0.854 29,878 -6,122 -5,122 0.830 0.854 20,483 11.714 Period 3 Period 4 15,000 10,000 50,000 60,000 18,000 12,000 54,000 66,000 25.0095 31.0096 29.5056 35.00% 0.847 0.886 42,3731 53,143 - 11,627 -12,857 -7,627 -6,857 0.785 0.805 0.847 0.886 21,665 21,113 1 1.800 11.290 Period 5 25,000 85,000 29,000 95,000 4 6.0098 50.0096 0.920 78,200 -16,800] -6,800 0.823 0.920 2 0,652 10.870 Period 6 15,000 100,000 17,000 112.000 55.0096 59.00% 0.932 93,220 -18,780 -6,780 0.832 0.932 20,425 10.727 120.000 1.000 0900 100,000 30,000 60,000 40,000 20,000 0.800 0.700 0.600 0.500 0.400 0100 D.200 0.100 10,000 35,000 50,000 60,000 85.000 100.000 D.DDO -Cumulative Planned Value (PV) -Cumulative Actual Cost 10,000 35,000 54,000 66.000 95,000 - Cost Perf Indiator(CPI) EV/AC 0.667 0.830 0.785 0.805 0.823 (AC) -Earned Value (EV) 6,667 29,878 42,373 53,143 78,200 Schedule Perf Ind (SPI) EV/PV 0.667 0854 0.847 0.886 17000 Budget at Completion (BAC) 10 Planned Time to Complete 2 Planned Value (PY) 3 Cumulative Planned Value (PV) 4 Actual Cost (AC) 5 Cumulative Actual Cost (AC) 6 7 Actual York Complete 7 Z Planned York Complete 8 Rate of Performance (RP) 9 Earned Value (EY) = PY'RP 10 Cost Variance (CY) = EY-AC 11 Schedule Variance (SY) = EY-PY 12 Cost Perf Indicator (CPI) - EVIAC 13 Schedule Perf Ind (SPI) = EYIPY 14 Estimate at Completion (EAC) Estimated Time to Complete Period 1 10,000 10,000 10,000 10,000 8.0095 6.0095 1.333 13,333 3,333 3,333 1.333 1.333 12,750 7.500 Period 2 25,000 35,000 26,000 36,0001 24.0096 20.5091 1.171 40,976 4,976 5,976 1.138 1.171 14,936 8.542 Period 3 15,000 50,000 18,000 54,000 32.5096 29.50% 1.102 55,085 1,085 5,085 1.020 1.102 16,665 9.0771 Period 4 Period 5 Period 6 10,000 25,000 15,000 85,000 100,000 12,000 29,000 17,000 66,000 95,000 112,000 37.50% 54.009 62.5096 35.00% 50.00% 59.00% 1.071 1.080 1.059 64,286 91,800 | 105,932 -1,714 3 ,200 -6,068 4,286 6,800 5,932 0.9740.9660.946 1.071 1.080 1.059 17,453 17,593 17,974 9.333 9.259 9.4401 120,000 1.400 100,000 1.200 1000 80,000 0.800 60,000 0.600 40,000 0.400 20,000 0.200 D.DDO 10,000 35 000 50.000 60.000 85.000 100,000 1138 1.020 -Cumulative Planned Value (PV) -Cumulative Actual Cost (AC) -Eamed Value (Ev) = PV RP 10,000 13,333 36,000 40,976 54,000 55,085 66.000 54 285 Cost Perf indicator(CPI) EV/AC Schedule Perf Ind (SPI) = EV/PV 95.000 91,800 1171 1.102 1.071 17000 Budget at Completion (BAC) 10 Planned Time to Complete 2 Planned Value (PY) 3 Cumulative Planned Value (PV) 4 Actual Cost (AC) 5 Cumulative Actual Cost (AC) 6 7 Actual York Complete 7 Z Planned York Complete 8 Rate of Performance (RP) 9 Earned Value (EY) = PY'RP 10 Cost Variance (CY) = EY-AC 11 Schedule Variance (SY) = EY-PY 12 Cost Perf Indicator (CPI) - EVIAC 13 Schedule Perf Ind (SPI) = EY/PY 14 Estimate at Completion (EAC) Estimated Time to Complete Period 1 10,000 10,000 8,000 8,000 4.0096 6.0098 0.667 6,667 -1,333 -3,333 0.833 0.667 20,400 15.000 Period 2 25,000 35,000 17,500 25,500 17.5096 20.5096 0.854 29,878 4,378 -5,122 1.172|| 0.854 14,509 11.714 Period 3 15,000 50,000 9,000 34,500 25.0096 29.50% 0.847 42,373 7,873 -7,627 1.228 0.847 13,841 11.800 Period 4 10,000 60,000 14,000 48,500 31.0096 35.00% 0.886 53,143 4,643 -6,857 1.096 0.886 15,515| 11.290 Period 5 25,000 85,000 20,500 69,000 4 6.00% 50.00% 0.920 78,200 9,200 -6,800 1.133 0.920 15,000 10.870 Period 6 15,000 100,000 11,500 80,500 55.0096 59.00% 0.932 93,220 12,720 -6,780| 1.158 0.932 14,680 10.727 120,000 1.400 100,000 1.200 1000 80,000 0.800 60,000 0.600 40,000 0.400 20,000 0.200 D.DDD 10,000 35 000 50.000 60.000 85.000 100,000 0.833 1172 -Cumulative Planned Value (PV) -Cumulative Actual Cost (AC) -Eamed Value (EV)=PV*RP Cost Perf indicator(CPI) EV/AC Schedule Perfind (SPI) - EV/PV 8,000 6,667 25,500 29,878 34,500 42,373 48,500 53,143 69,000 78,200 17000 Budget at Completion (BAC) 10 Planned Time to Complete 2 Planned Value (PY) 3 Cumulative Planned Value (PY 4 Actual Cost (AC) 5 Cumulative Actual Cost (AC) 6 Actual Vork Complete 7 Z Planned York Complete 8 Rate of Performance (RP) 19 Earned Value (EY) = PY"RP 10 Cost Variance (CY) = EY-AC 11 Schedule Variance (SV) - EVL 12 Cost Perf Indicator (CPI) - EY 13 Schedule Perf Ind (SPI) = EYLI 14 Estimate at Completion (EAC Estimated Time to Complete Period 1 10,000 10,000 10,000 10,000 4.0096 6.00% 0.667 6,6671 -3,333 3,333 0.667 0.667 25,500 15.000 Period 2 25,000 35,000 26,000 36,000 17.5096 20.5095 0.854 29,878 -6,122 -5,122 0.830 0.854 20,483 11.714 Period 3 Period 4 15,000 10,000 50,000 60,000 18,000 12,000 54,000 66,000 25.0095 31.0096 29.5056 35.00% 0.847 0.886 42,3731 53,143 - 11,627 -12,857 -7,627 -6,857 0.785 0.805 0.847 0.886 21,665 21,113 1 1.800 11.290 Period 5 25,000 85,000 29,000 95,000 4 6.0098 50.0096 0.920 78,200 -16,800] -6,800 0.823 0.920 2 0,652 10.870 Period 6 15,000 100,000 17,000 112.000 55.0096 59.00% 0.932 93,220 -18,780 -6,780 0.832 0.932 20,425 10.727 120.000 1.000 0900 100,000 30,000 60,000 40,000 20,000 0.800 0.700 0.600 0.500 0.400 0100 D.200 0.100 10,000 35,000 50,000 60,000 85.000 100.000 D.DDO -Cumulative Planned Value (PV) -Cumulative Actual Cost 10,000 35,000 54,000 66.000 95,000 - Cost Perf Indiator(CPI) EV/AC 0.667 0.830 0.785 0.805 0.823 (AC) -Earned Value (EV) 6,667 29,878 42,373 53,143 78,200 Schedule Perf Ind (SPI) EV/PV 0.667 0854 0.847 0.886 17000 Budget at Completion (BAC) 10 Planned Time to Complete 2 Planned Value (PY) 3 Cumulative Planned Value (PV) 4 Actual Cost (AC) 5 Cumulative Actual Cost (AC) 6 7 Actual York Complete 7 Z Planned York Complete 8 Rate of Performance (RP) 9 Earned Value (EY) = PY'RP 10 Cost Variance (CY) = EY-AC 11 Schedule Variance (SY) = EY-PY 12 Cost Perf Indicator (CPI) - EVIAC 13 Schedule Perf Ind (SPI) = EYIPY 14 Estimate at Completion (EAC) Estimated Time to Complete Period 1 10,000 10,000 10,000 10,000 8.0095 6.0095 1.333 13,333 3,333 3,333 1.333 1.333 12,750 7.500 Period 2 25,000 35,000 26,000 36,0001 24.0096 20.5091 1.171 40,976 4,976 5,976 1.138 1.171 14,936 8.542 Period 3 15,000 50,000 18,000 54,000 32.5096 29.50% 1.102 55,085 1,085 5,085 1.020 1.102 16,665 9.0771 Period 4 Period 5 Period 6 10,000 25,000 15,000 85,000 100,000 12,000 29,000 17,000 66,000 95,000 112,000 37.50% 54.009 62.5096 35.00% 50.00% 59.00% 1.071 1.080 1.059 64,286 91,800 | 105,932 -1,714 3 ,200 -6,068 4,286 6,800 5,932 0.9740.9660.946 1.071 1.080 1.059 17,453 17,593 17,974 9.333 9.259 9.4401 120,000 1.400 100,000 1.200 1000 80,000 0.800 60,000 0.600 40,000 0.400 20,000 0.200 D.DDO 10,000 35 000 50.000 60.000 85.000 100,000 1138 1.020 -Cumulative Planned Value (PV) -Cumulative Actual Cost (AC) -Eamed Value (Ev) = PV RP 10,000 13,333 36,000 40,976 54,000 55,085 66.000 54 285 Cost Perf indicator(CPI) EV/AC Schedule Perf Ind (SPI) = EV/PV 95.000 91,800 1171 1.102 1.071


