

Question: Projectile trajectory (plot of multiple data series) My Solution Consider the motion of an object modeled with ideal projectile motion (neglecting air resistance). The trajectory
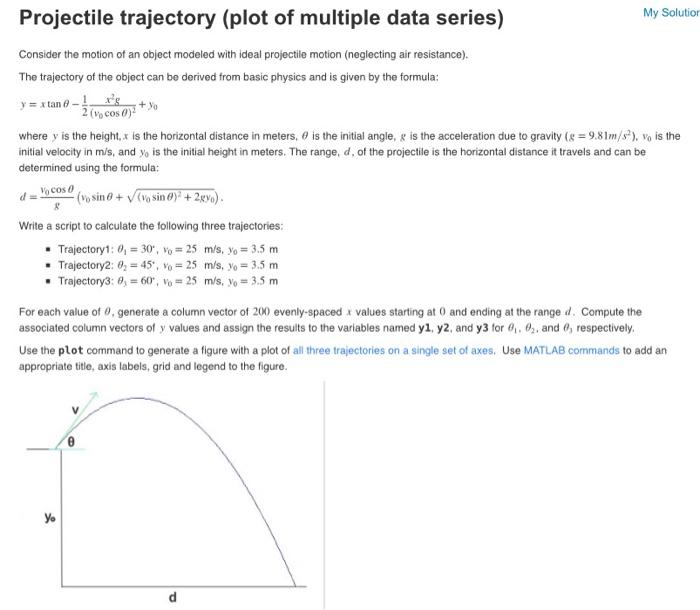
Projectile trajectory (plot of multiple data series) My Solution Consider the motion of an object modeled with ideal projectile motion (neglecting air resistance). The trajectory of the object can be derived from basic physics and is given by the formula: y = x tan 0-1 r's 2 (ivcos 0)2 + where y is the height, x is the horizontal distance in meters, is the initial angle, & is the acceleration due to gravity (8 = 9.81m/s), v) is the initial velocity in m's, and y, is the initial height in meters. The range, d, of the projectile is the horizontal distance it travels and can be determined using the formula: Vocoso (sino + Vivo sin 6)* + 2880) d 8 Write a script to calculate the following three trajectories: Trajectory1: 0, = 30, Vo = 25 m/s, Yo = 3.5 m Trajectory2: 0, = 45, Vo = 25 m/s, yo = 3.5 m Trajectory3: 0; = 60, Vo = 25 m/s, Yo = 3.5 m For each value of 0, generate a column vector of 200 evenly-spaced x values starting at 0 and ending at the range d. Compute the associated column vectors of y values and assign the results to the variables named y1, y2, and y3 for 6.0, and 6, respectively Use the plot command to generate a figure with a plot of all three trajectories on a single set of axes. Use MATLAB commands to add an appropriate title, axis labels, grid and legend to the figure. yo d
Step by Step Solution
There are 3 Steps involved in it

Get step-by-step solutions from verified subject matter experts