

Question: Projects 3 & 4 are mutually exclusive. 3 1 Investment Decision Spreadsheet 2 3 Cash flows: 4 Project: 1 2 5 Initial cost: -5000 -5000
 Projects 3 & 4 are mutually exclusive.
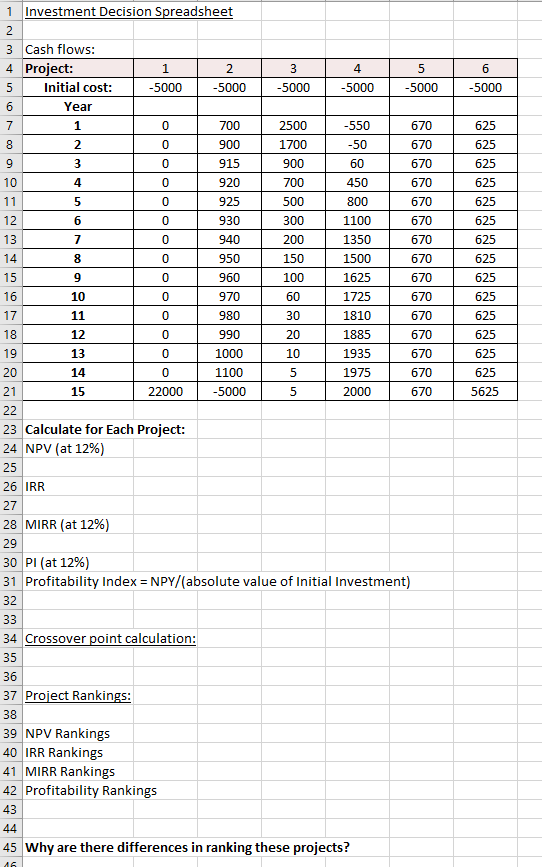
3 1 Investment Decision Spreadsheet 2 3 Cash flows: 4 Project: 1 2 5 Initial cost: -5000 -5000 6 Year 7 1 0 700 8 2 0 900 9 3 0 915 4 -5000 5 -5000 6 -5000 -5000 625 2500 1700 900 -550 -50 60 670 670 670 625 625 10 4 0 700 450 670 625 500 800 670 11 12 13 5 6 0 0 920 925 930 940 950 960 7 0 0 1100 1350 1500 300 200 150 100 60 670 670 670 670 625 625 625 625 625 625 14 8 15 9 0 1625 16 10 0 1725 670 17 30 625 11 12 13 0 0 970 980 990 1000 1100 -5000 20 10 1810 1885 1935 670 670 670 18 19 20 21 625 625 0 0 14 5 670 625 1975 2000 15 22000 5 670 5625 22 23 Calculate for Each Project: 24 NPV (at 12%) 25 26 IRR 27 28 MIRR (at 12%) 29 30 PI (at 12%) 31 Profitability Index = NPY/(absolute value of Initial Investment) 32 33 34 Crossover point calculation: 35 36 37 Project Rankings: 38 39 NPV Rankings 40 IRR Rankings 41 MIRR Rankings 42 Profitability Rankings 43 44 45 Why are there differences in ranking these projects? 16
Step by Step Solution
There are 3 Steps involved in it

Get step-by-step solutions from verified subject matter experts