

Question: Proportion Test (N Outcomes) Proportions - marshmallow Level Count Proportion with Observed 20 0.345 Expected 29.0 0.500 without Observed 38 0.655 Expected 29.0 0.500 x2
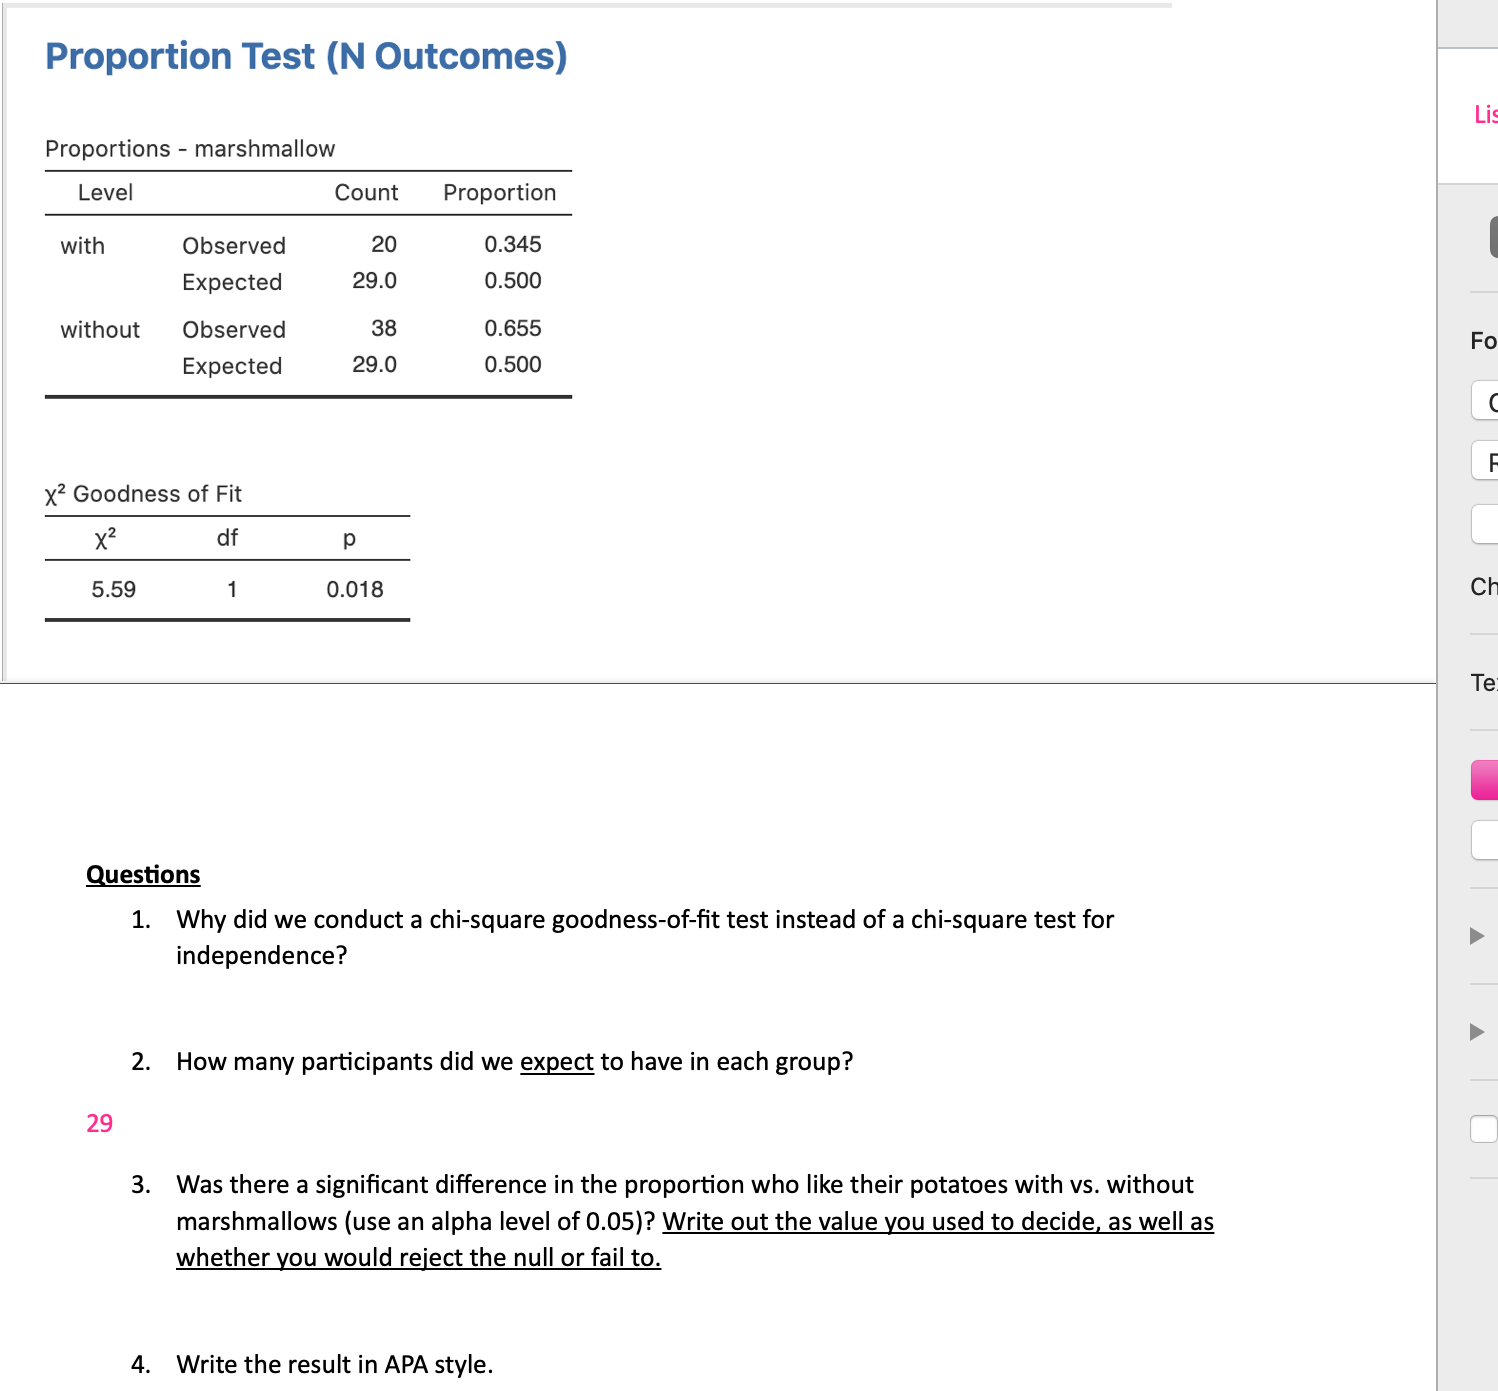
Proportion Test (N Outcomes) Proportions - marshmallow Level Count Proportion with Observed 20 0.345 Expected 29.0 0.500 without Observed 38 0.655 Expected 29.0 0.500 x2 Goodness of Fit x2 df p 5.59 1 0.018 Questions 1. Why did we conduct a chi-square goodness-oft test instead of a chi-square test for independence? 2. How many participants did we expect to have in each group? 29 3. Was there a signicant difference in the proportion who like their potatoes with vs. without marshmallows (use an alpha level of 0.05)? Write out the value you used to decide. as well as whether you would reiect the null or fail to. 4. Write the result in APA style. Fo Ch Te
Step by Step Solution
There are 3 Steps involved in it

Get step-by-step solutions from verified subject matter experts