

Question: Provide a declining margin version of the NPV analysis, using the Exhibit 7 values and forecasting cash-flows thru 2023, include the terminal value in 2023.
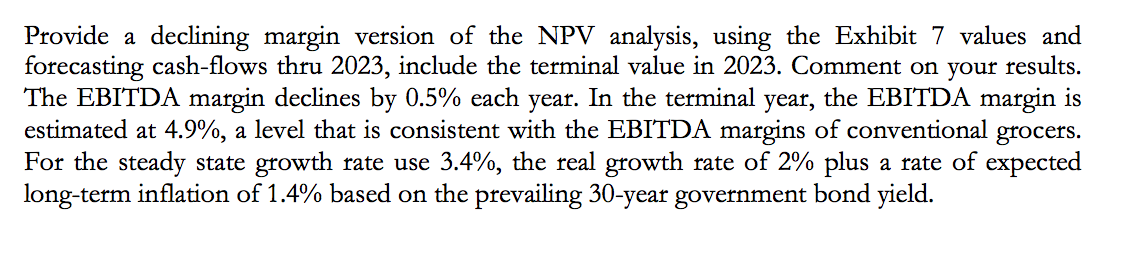
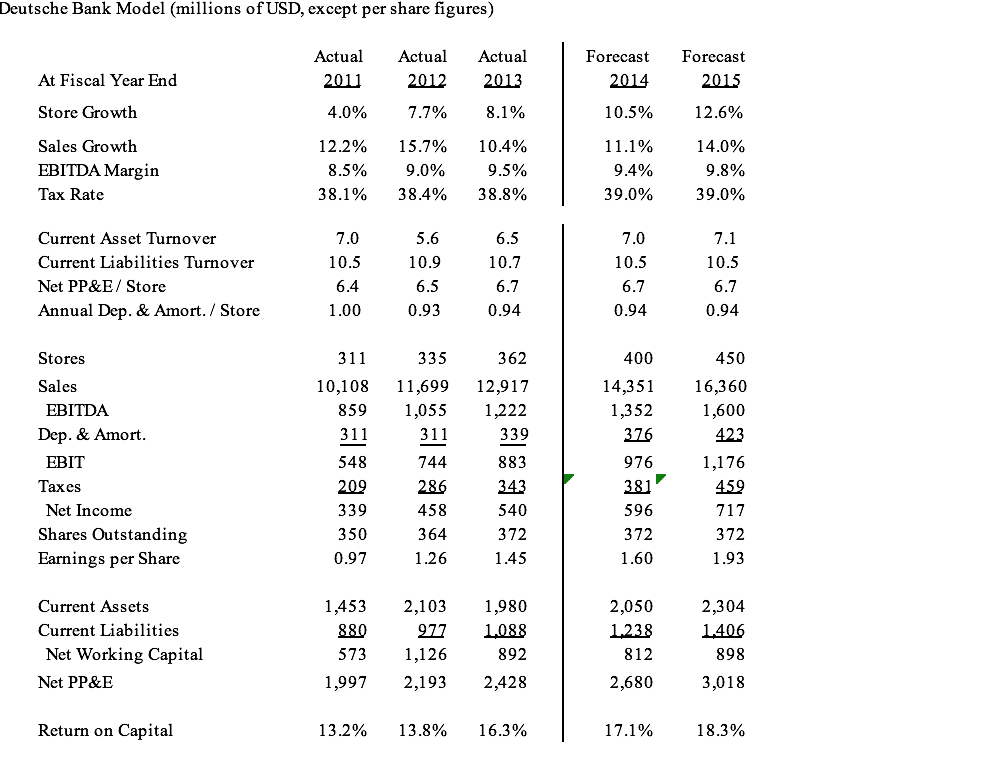
Provide a declining margin version of the NPV analysis, using the Exhibit 7 values and forecasting cash-flows thru 2023, include the terminal value in 2023. Comment on your results. The EBITDA margin declines by 0.5% each year. In the terminal year, the EBITDA margin is estimated at 4.9%, a level that is consistent with the EBITDA margins of conventional grocers. For the steady state growth rate use 3.4%, the real growth rate of 2% plus a rate of expected long-term inflation of 1.4% based on the prevailing 30-year government bond yield. Deutsche Bank Model (millions of USD, except per share figures) Actual 2011 Actual 2012 7.7% At Fiscal Year End Store Growth Actual 2013 8.1% Forecast 2014 Forecast 2015 12.6% 4.0% 10.5% Sales Growth EBITDA Margin Tax Rate 12.2% 8.5% 38.1% 15.7% 9.0% 38.4% 10.4% 9.5% 38.8% 11.1% 9.4% 39.0% 14.0% 9.8% 39.0% Current Asset Turnover Current Liabilities Turnover Net PP&E/ Store Annual Dep. & Amort / Store 7.0 10.5 6.4 7.0 10.5 5.6 10.9 6.5 0.93 6.5 10.7 6.7 0.94 7.1 10.5 6.7 0.94 6.7 0.94 1.00 Stores Sales EBITDA Dep. & Amort. EBIT Taxes Net Income Shares Outstanding Earnings per Share 311 335 10,108 11,699 8591,055 311 311 548 744 209 286 339 458 350 364 0.97 1.26 362 12,917 1,222 339 883 343 540 372 1.45 400 14,351 1,352 376 976 450 16,360 1,600 423 1,176 459 717 372 1.93 381 596 372 1.60 Current Assets Current Liabilities Net Working Capital Net PP&E 1,453 880 573 1,997 2,103 2 77 1,126 2,193 1,980 1.088 892 2,428 2,050 1.238 812 2,680 2,304 1.406 898 3,018 Return on Capital 13.2% 13.8% 16.3% 17.1% 18.3% Provide a declining margin version of the NPV analysis, using the Exhibit 7 values and forecasting cash-flows thru 2023, include the terminal value in 2023. Comment on your results. The EBITDA margin declines by 0.5% each year. In the terminal year, the EBITDA margin is estimated at 4.9%, a level that is consistent with the EBITDA margins of conventional grocers. For the steady state growth rate use 3.4%, the real growth rate of 2% plus a rate of expected long-term inflation of 1.4% based on the prevailing 30-year government bond yield. Deutsche Bank Model (millions of USD, except per share figures) Actual 2011 Actual 2012 7.7% At Fiscal Year End Store Growth Actual 2013 8.1% Forecast 2014 Forecast 2015 12.6% 4.0% 10.5% Sales Growth EBITDA Margin Tax Rate 12.2% 8.5% 38.1% 15.7% 9.0% 38.4% 10.4% 9.5% 38.8% 11.1% 9.4% 39.0% 14.0% 9.8% 39.0% Current Asset Turnover Current Liabilities Turnover Net PP&E/ Store Annual Dep. & Amort / Store 7.0 10.5 6.4 7.0 10.5 5.6 10.9 6.5 0.93 6.5 10.7 6.7 0.94 7.1 10.5 6.7 0.94 6.7 0.94 1.00 Stores Sales EBITDA Dep. & Amort. EBIT Taxes Net Income Shares Outstanding Earnings per Share 311 335 10,108 11,699 8591,055 311 311 548 744 209 286 339 458 350 364 0.97 1.26 362 12,917 1,222 339 883 343 540 372 1.45 400 14,351 1,352 376 976 450 16,360 1,600 423 1,176 459 717 372 1.93 381 596 372 1.60 Current Assets Current Liabilities Net Working Capital Net PP&E 1,453 880 573 1,997 2,103 2 77 1,126 2,193 1,980 1.088 892 2,428 2,050 1.238 812 2,680 2,304 1.406 898 3,018 Return on Capital 13.2% 13.8% 16.3% 17.1% 18.3%
Step by Step Solution
There are 3 Steps involved in it

Get step-by-step solutions from verified subject matter experts