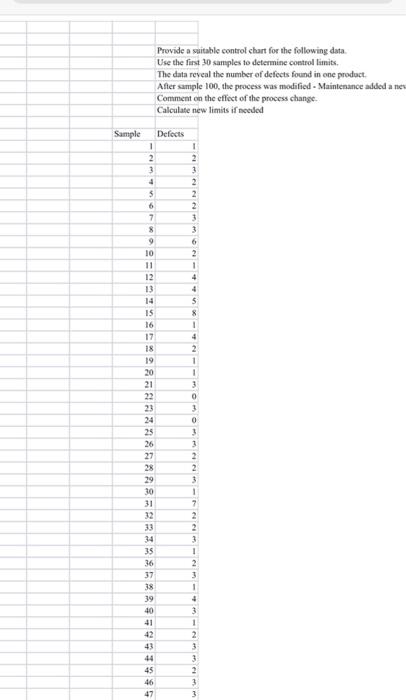
Question: Provide a suitable control chart for the following data Use the first 30 samples to determine control limits. The data reveal the number of defects

Provide a suitable control chart for the
Provide a suitable control chart for the following data Use the first 30 samples to determine control limits. The data reveal the number of defects found in one product After sample 100, the process was modified - Maintenance added a ne Comment on the effect of the process change Calculate new limits if needed Sample Defects 1 2 3 4 1 2 3 2 2 2 3 $ 6 7 3 8 9 6 2 10 11 12 13 1 4 4 5 $ 1 4 2 1 1 3 0 3 15 16 17 18 19 20 21 22 23 24 25 26 27 28 29 30 31 32 33 34 35 36 37 38 39 40 41 42 43 0 3 3 2 2 3 1 7 2 2 3 1 2 3 1 4 3 1 2 3 3 45 46 47 2 3 3

Step by Step Solution

There are 3 Steps involved in it

1 Expert Approved Answer
Step: 1 Unlock blur-text-image
Question Has Been Solved by an Expert!

Get step-by-step solutions from verified subject matter experts

Step: 2 Unlock
Step: 3 Unlock

Students Have Also Explored These Related General Management Questions!