

Question: Provider A Provider B Problems 5.1 Consider the CVP graphs below for two providers operating in a fee- for-service environment: a. Assuming the graphs are
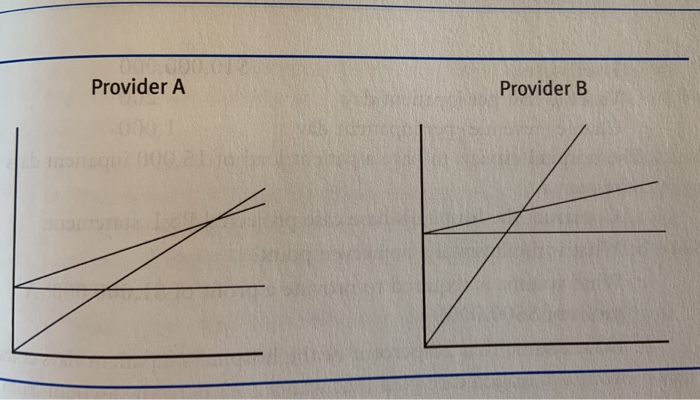
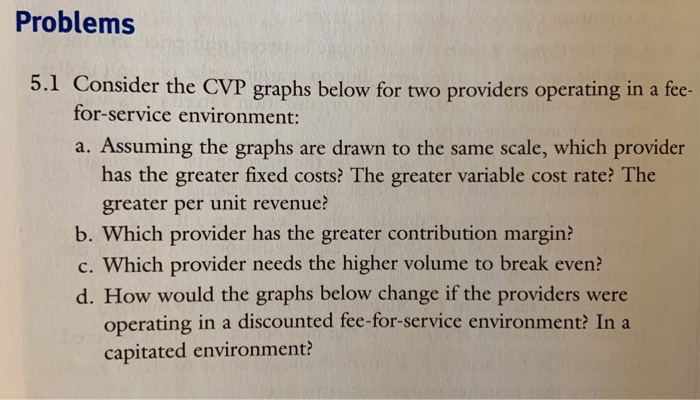
Provider A Provider B Problems 5.1 Consider the CVP graphs below for two providers operating in a fee- for-service environment: a. Assuming the graphs are drawn to the same scale, which provider eater fixed costs? The greater greater per unit revenue? b. Which provider has the greater contribution margin? c. Which provider needs the higher volume to break even? d. How would the graphs below change if the providers were operating in a discounted fee-for-service environment? In a capitated environment
Step by Step Solution
There are 3 Steps involved in it
1 Expert Approved Answer
Step: 1 Unlock

Question Has Been Solved by an Expert!
Get step-by-step solutions from verified subject matter experts
Step: 2 Unlock
Step: 3 Unlock