

Question: PS Fill in the following code to plot the vectors with blue asterisks. * = :pi/10:2*pi; sin(x); figure plot(x,y, HTML Editora B IV A -
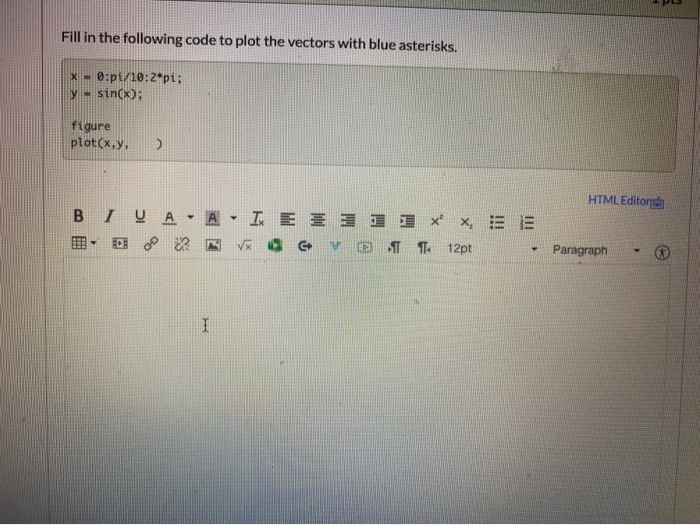
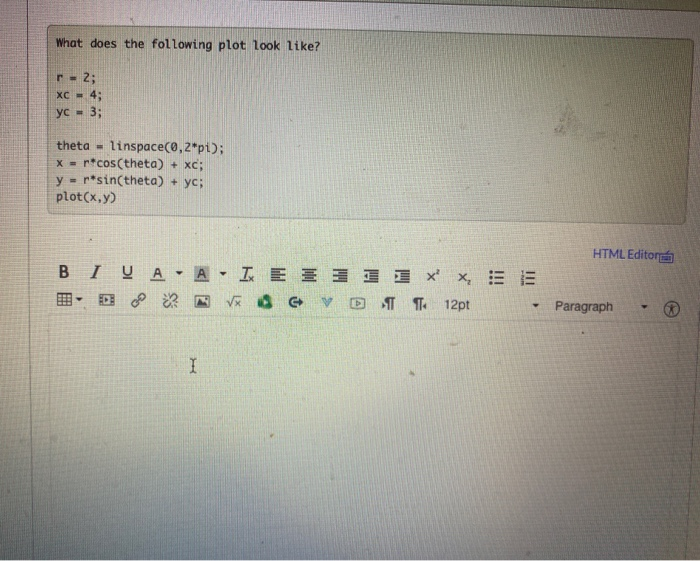
PS Fill in the following code to plot the vectors with blue asterisks. * = :pi/10:2*pi; sin(x); figure plot(x,y, HTML Editora B IV A - A. I E3311xx= 13- DNV G OTT 12pt Paragraph Add labels to the previous plot. The x axis should be labeled values of PI The y-axis should be sine of PI. HTML Editore BI y A - A - -Doo ? N Ix E 3 1 x , ! OG VOLT 12pt Paragraph O words What does the following plot look like? r2 XC-43 yC = 3; theta - linspace(0,2*pi); X = ricos(theta) + Xc; y - rsin(theta) + yo; plot(x,y) 1 x BIVA - A - IE * 1 - S V S VO , 12pt HTML Editore E - Paragraph - What are the six comparators? HTML Edita BIVA - A - I E III IX X, DE - OD NVX QG VOIT 12pt - Paragraph
Step by Step Solution
There are 3 Steps involved in it

Get step-by-step solutions from verified subject matter experts