

Question: PS2 Data 1 3. Download the Excel file PS2 Data 1 from NYU Classes. It contains the (actual) annual returns on Coca-Cola (KO) and Walmart
PS2 Data 1
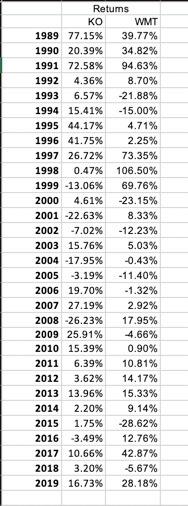
3. Download the Excel file "PS2 Data 1" from NYU Classes. It contains the (actual) annual returns on Coca-Cola (KO) and Walmart (WMT) for 31 years (1989-2019). a. Calculate of the arithmetic average return (function =AVERAGE) and the volatility of the return (function =STDEV) for the 2 stocks, and the correlation between them (function = CORREL). b. Using the numbers above as estimates of the expected return, standard deviation, and correlation, plot the investment opportunity set using the two stocks for weights in Coca-Cola between 0% and 150% ( 0 to 1.5). \begin{tabular}{|r|r|r|} \hline & \multicolumn{1}{|r|}{ Retums } \\ \hline & KO & WMT \\ \hline 1989 & 77.15% & 39.77% \\ \hline 1990 & 20.39% & 34.82% \\ \hline 1991 & 72.58% & 94.63% \\ \hline 1992 & 4.36% & 8.70% \\ \hline 1993 & 6.57% & 21.88% \\ \hline 1994 & 15.41% & 15.00% \\ \hline 1995 & 44.17% & 4.71% \\ \hline 1996 & 41.75% & 2.25% \\ \hline 1997 & 26.72% & 73.35% \\ \hline 1998 & 0.47% & 106.50% \\ \hline 1999 & 13.06% & 69.76% \\ \hline 2000 & 4.61% & 23.15% \\ \hline 2001 & 22.63% & 8.33% \\ \hline 2002 & 7.02% & 12.23% \\ \hline 2003 & 15.76% & 5.03% \\ \hline 2004 & 17.95% & 0.43% \\ \hline 2005 & 3.19% & 11.40% \\ \hline 2006 & 19.70% & 1.32% \\ \hline 2007 & 27.19% & 2.92% \\ \hline 2008 & 26.23% & 17.95% \\ \hline 2009 & 25.91% & 4.66% \\ \hline 2010 & 15.39% & 0.90% \\ \hline 2011 & 6.39% & 10.81% \\ \hline 2012 & 3.62% & 14.17% \\ \hline 2013 & 13.96% & 15.33% \\ \hline 2014 & 2.20% & 9.14% \\ \hline 2015 & 1.75% & 28.62% \\ \hline 2016 & 3.49% & 12.76% \\ \hline 2017 & 10.66% & 42.87% \\ \hline 2018 & 3.20% & 5.67% \\ \hline & 16.73% & 28.18% \\ \hline & \\ \hline \end{tabular} 3. Download the Excel file "PS2 Data 1" from NYU Classes. It contains the (actual) annual returns on Coca-Cola (KO) and Walmart (WMT) for 31 years (1989-2019). a. Calculate of the arithmetic average return (function =AVERAGE) and the volatility of the return (function =STDEV) for the 2 stocks, and the correlation between them (function = CORREL). b. Using the numbers above as estimates of the expected return, standard deviation, and correlation, plot the investment opportunity set using the two stocks for weights in Coca-Cola between 0% and 150% ( 0 to 1.5). \begin{tabular}{|r|r|r|} \hline & \multicolumn{1}{|r|}{ Retums } \\ \hline & KO & WMT \\ \hline 1989 & 77.15% & 39.77% \\ \hline 1990 & 20.39% & 34.82% \\ \hline 1991 & 72.58% & 94.63% \\ \hline 1992 & 4.36% & 8.70% \\ \hline 1993 & 6.57% & 21.88% \\ \hline 1994 & 15.41% & 15.00% \\ \hline 1995 & 44.17% & 4.71% \\ \hline 1996 & 41.75% & 2.25% \\ \hline 1997 & 26.72% & 73.35% \\ \hline 1998 & 0.47% & 106.50% \\ \hline 1999 & 13.06% & 69.76% \\ \hline 2000 & 4.61% & 23.15% \\ \hline 2001 & 22.63% & 8.33% \\ \hline 2002 & 7.02% & 12.23% \\ \hline 2003 & 15.76% & 5.03% \\ \hline 2004 & 17.95% & 0.43% \\ \hline 2005 & 3.19% & 11.40% \\ \hline 2006 & 19.70% & 1.32% \\ \hline 2007 & 27.19% & 2.92% \\ \hline 2008 & 26.23% & 17.95% \\ \hline 2009 & 25.91% & 4.66% \\ \hline 2010 & 15.39% & 0.90% \\ \hline 2011 & 6.39% & 10.81% \\ \hline 2012 & 3.62% & 14.17% \\ \hline 2013 & 13.96% & 15.33% \\ \hline 2014 & 2.20% & 9.14% \\ \hline 2015 & 1.75% & 28.62% \\ \hline 2016 & 3.49% & 12.76% \\ \hline 2017 & 10.66% & 42.87% \\ \hline 2018 & 3.20% & 5.67% \\ \hline & 16.73% & 28.18% \\ \hline & \\ \hline \end{tabular}
Step by Step Solution
There are 3 Steps involved in it

Get step-by-step solutions from verified subject matter experts