

Question: Question no 3: Excel exercises This problem is to be completed in Excel. Download the Excel le PS3 Data from NYU Classes. It contains the
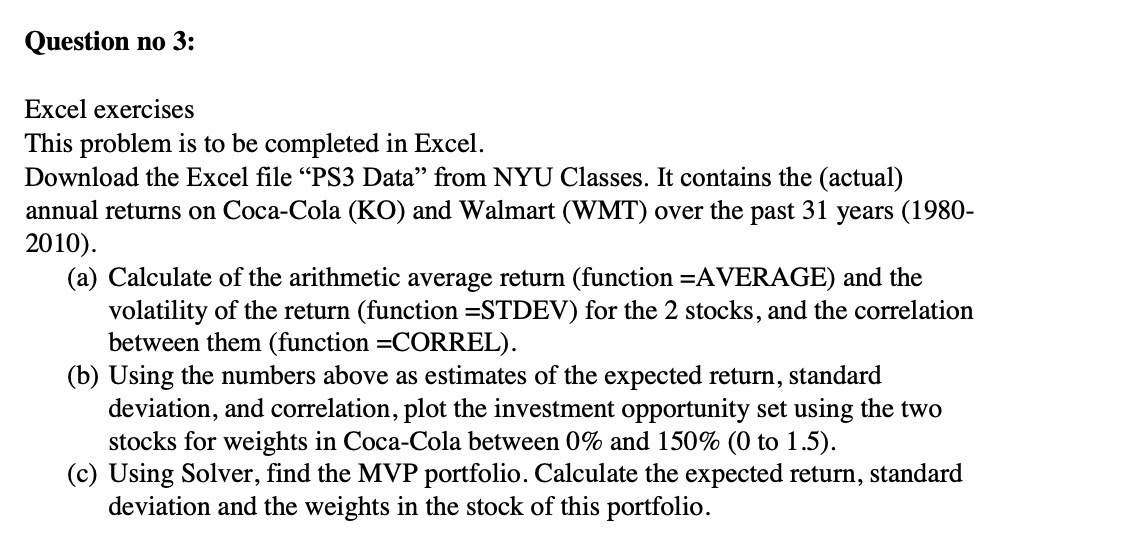
Question no 3: Excel exercises This problem is to be completed in Excel. Download the Excel le \"PS3 Data\" from NYU Classes. It contains the (actual) annual returns on Coca-Cola (K0) and Walmart (WMT) over the past 31 years (1980- 2010). (a) Calculate of the arithmetic average return (function =AVERAGE) and the volatility of the return (function =STDEV) for the 2 stocks, and the correlation between them (function =CORREL). (b) Using the numbers above as estimates of the expected return, standard deviation, and correlation, plot the investment opportunity set using the two stocks for weights in Coca-Cola between 0% and 150% (0 to 1 .5). (c) Using Solver, nd the MVP portfolio. Calculate the expected return, standard deviation and the weights in the stock of this portfolio
Step by Step Solution
There are 3 Steps involved in it

Get step-by-step solutions from verified subject matter experts