

Question: python 3 6. (16 pts) Consider a dataset sales_data.csv which consists of property sales in Milwaukee, Wisconsin from 2002 to 2018. The features of these
python 3
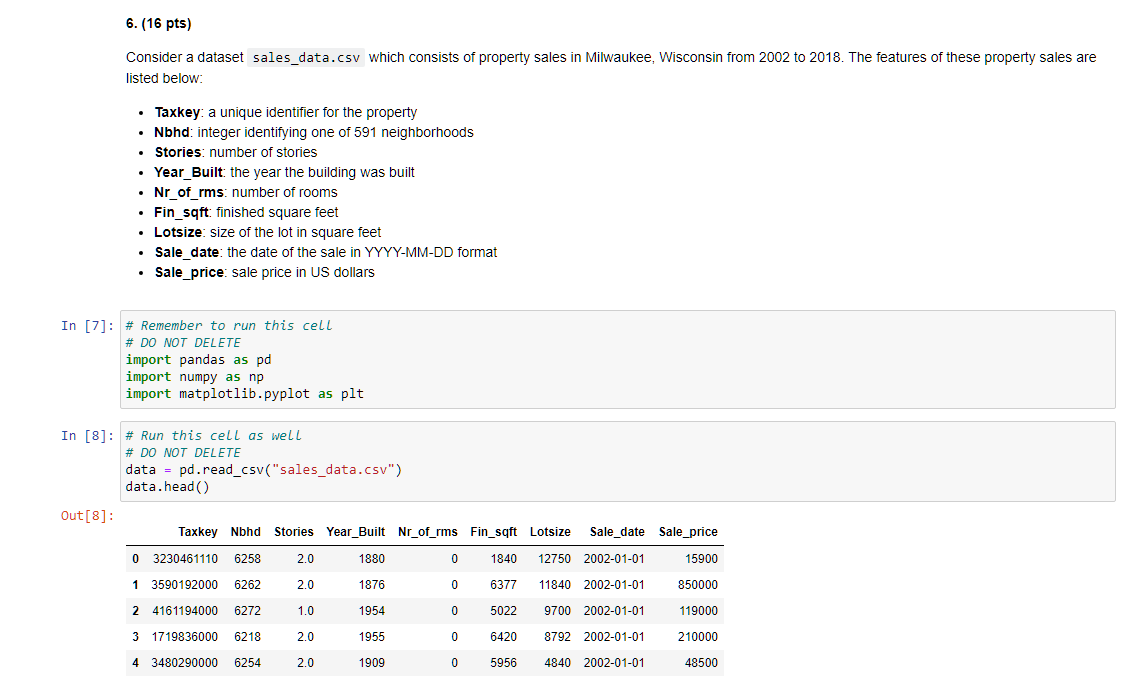
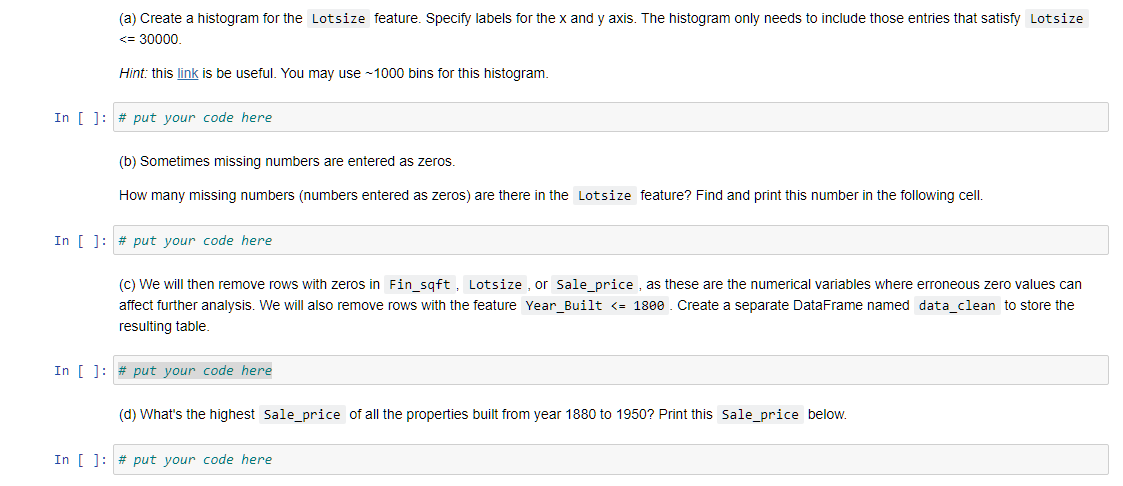
6. (16 pts) Consider a dataset sales_data.csv which consists of property sales in Milwaukee, Wisconsin from 2002 to 2018. The features of these property sales are listed below: Taxkey: a unique identifier for the property Nbhd: integer identifying one of 591 neighborhoods Stories: number of stories Year_Built the year the building was built Nr_of_rms: number of rooms Fin_sqft: finished square feet Lotsize: size of the lot in square feet Sale_date: the date of the sale in YYYY-MM-DD format Sale_price: sale price in US dollars In [7]: # Remember to run this cell # DO NOT DELETE import pandas as pd import numpy as np import matplotlib.pyplot as plt In [8] : # Run this cell as well # DO NOT DELETE data = pd.read_csv("sales_data.csv") data.head() Out[8]: Taxkey Nbhd Stories Year_Built Nr_of_rms Fin_sqft Lotsize Sale_date Sale_price 0 32304611106258 2.0 1880 0 1840 12750 2002-01-01 15900 1 3590192000 6262 2.0 1876 0 6377 11840 2002-01-01 850000 2 4161194000 6272 1.0 1954 0 5022 9700 2002-01-01 119000 3 1719836000 6218 2.0 1955 0 6420 8792 2002-01-01 210000 4 3480290000 6254 2.0 1909 0 5956 4840 2002-01-01 48500 (a) Create a histogram for the Lotsize feature. Specify labels for the x and y axis. The histogram only needs to include those entries that satisfy Lotsize
Step by Step Solution
There are 3 Steps involved in it

Get step-by-step solutions from verified subject matter experts