

Question: Python 3 Jupyter notebook 1. Rose diagrams NOAA collects wind directional data for the US which we can download and do whatever we like with
Python 3 Jupyter notebook
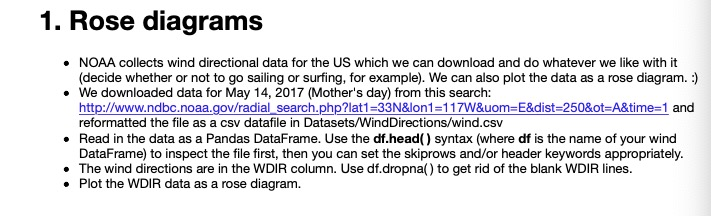
1. Rose diagrams NOAA collects wind directional data for the US which we can download and do whatever we like with it (decide whether or not to go sailing or surfing, for example). We can also plot the data as a rose diagram. ) . We downloaded data for May 14, 2017 (Mother's day) from this search: http://www.ndbc.noaa.gov/radial search.phplat1-33N&lon1-117W&uom E&dist-250&ot A&time-1 and reformatted the file as a csv datafile in Datasets/WindDirections/wind.csv Read in the data as a Pandas DataFrame. Use the df.head) syntax (where df is the name of your wind DataFrame) to inspect the file first, then you can set the skiprows and/or header keywords appropriately . The wind directions are in the WDIR column. Use df.dropna) to get rid of the blank WDIR lines .Plot the WDIR data as a rose diagram. 1. Rose diagrams NOAA collects wind directional data for the US which we can download and do whatever we like with it (decide whether or not to go sailing or surfing, for example). We can also plot the data as a rose diagram. ) . We downloaded data for May 14, 2017 (Mother's day) from this search: http://www.ndbc.noaa.gov/radial search.phplat1-33N&lon1-117W&uom E&dist-250&ot A&time-1 and reformatted the file as a csv datafile in Datasets/WindDirections/wind.csv Read in the data as a Pandas DataFrame. Use the df.head) syntax (where df is the name of your wind DataFrame) to inspect the file first, then you can set the skiprows and/or header keywords appropriately . The wind directions are in the WDIR column. Use df.dropna) to get rid of the blank WDIR lines .Plot the WDIR data as a rose diagram
Step by Step Solution
There are 3 Steps involved in it

Get step-by-step solutions from verified subject matter experts