

Question: python 3 Plot a Function Make a plot of the function h over the range x e[-4,4 exp(-1x2) h(x)- You will need to plot the
python 3
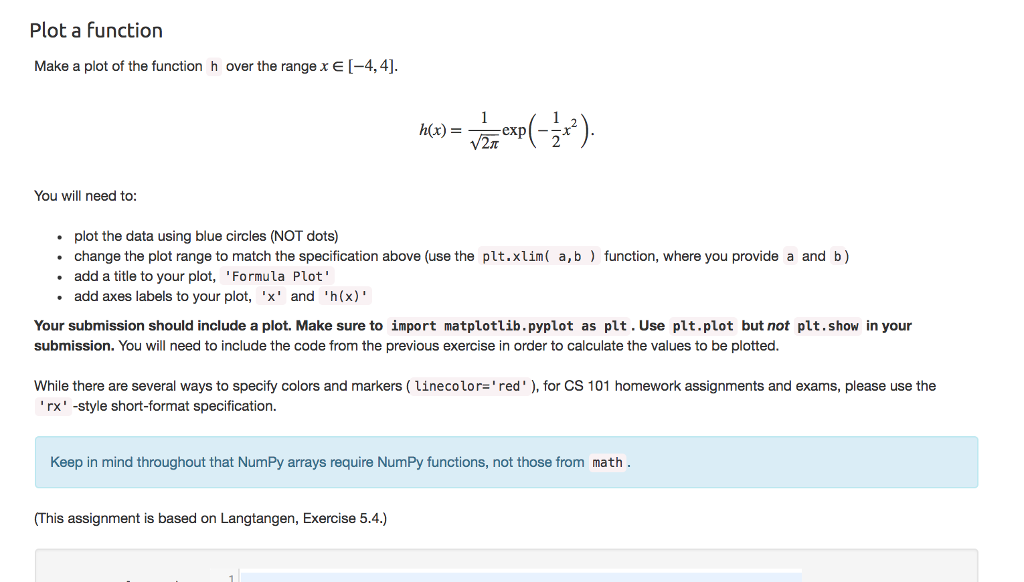
Plot a Function Make a plot of the function h over the range x e[-4,4 exp(-1x2) h(x)- You will need to plot the data using blue circles (NOT dots) change the plot range to match the specification above (use the plt.xlim( a,b) function, where you provide a and b) add a title to your plot,'Formula Plot' add axes labels to your plot, 'x' and 'h(x)" Your submission should include a plot. Make sure to import matplotlib.pyplot as plt. Use plt.plot but not plt.show in your submission. You will need to include the code from the previous exercise in order to calculate the values to be plotted. While there are several ways to specify colors and markers ( unecolor' red' ), for CS 101 homework assignments and exams, please use the "rx -style short-format specification. Keep in mind throughout that NumPy arrays require NumPy functions, not those from math This assignment is based on Langtangen, Exercise 5.4.)
Step by Step Solution
There are 3 Steps involved in it

Get step-by-step solutions from verified subject matter experts