

Question: Python Exercise 6.3 (5 points) In statistical physics the Debye theory gives the heat capacity of a solid as a function of the temperature T
Python
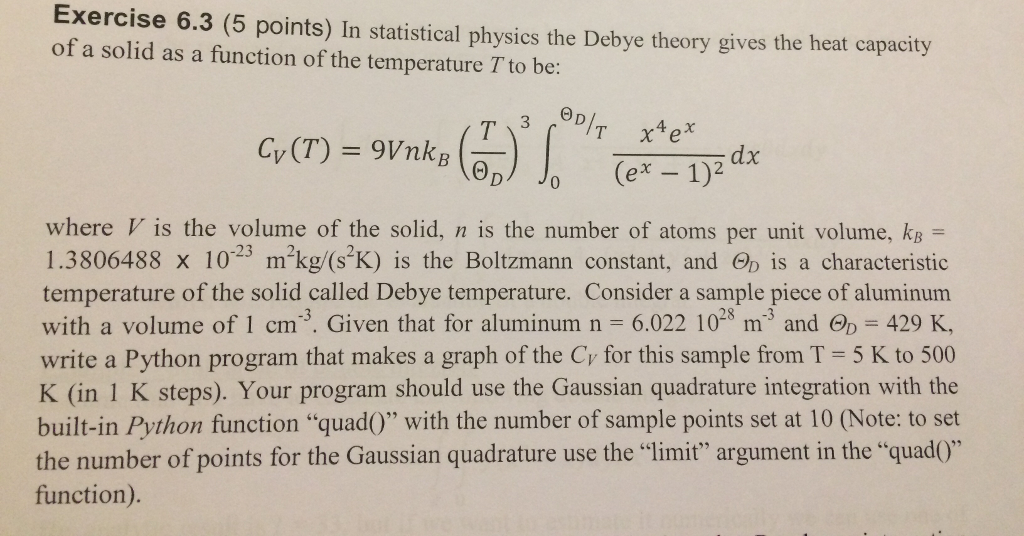
Exercise 6.3 (5 points) In statistical physics the Debye theory gives the heat capacity of a solid as a function of the temperature T to be: where Vis the volume of the solid, n is the number of atoms per unit volume, kB = 1.3806488 x 10² m'kg/(s'K) is the Boltzmann constant, and Op is a characteristic temperature of the solid called Debye temperature. Consider a sample piece of aluminum with a volume of 1 cm3. Given that for aluminum n 6.022 1028 m3 and 429 K, write a Python program that makes a graph of the Cy for this sample from T 5 K to 500 K (in 1 K steps). Your program should use the Gaussian quadrature integration with the built-in Python function "quadO" with the number of sample points set at 10 (Note: to set the number of points for the Gaussian quadrature use the "limit" argument in the "quad)" function). Exercise 6.3 (5 points) In statistical physics the Debye theory gives the heat capacity of a solid as a function of the temperature T to be: where Vis the volume of the solid, n is the number of atoms per unit volume, kB = 1.3806488 x 10² m'kg/(s'K) is the Boltzmann constant, and Op is a characteristic temperature of the solid called Debye temperature. Consider a sample piece of aluminum with a volume of 1 cm3. Given that for aluminum n 6.022 1028 m3 and 429 K, write a Python program that makes a graph of the Cy for this sample from T 5 K to 500 K (in 1 K steps). Your program should use the Gaussian quadrature integration with the built-in Python function "quadO" with the number of sample points set at 10 (Note: to set the number of points for the Gaussian quadrature use the "limit" argument in the "quad)" function)
Step by Step Solution
There are 3 Steps involved in it

Get step-by-step solutions from verified subject matter experts