

Question: PYTHON EXERCISES Create this graph in Python (the lines do not have to be the exact same, something close to it), you have to use
PYTHON EXERCISES
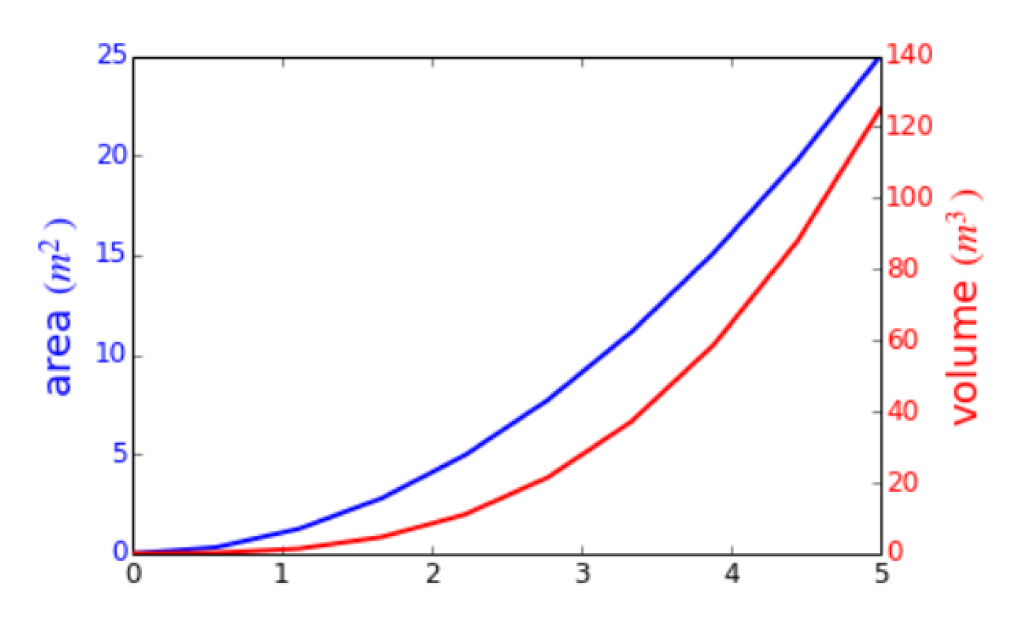
Create this graph in Python (the lines do not have to be the exact same, something close to it), you have to use 2 different colors.
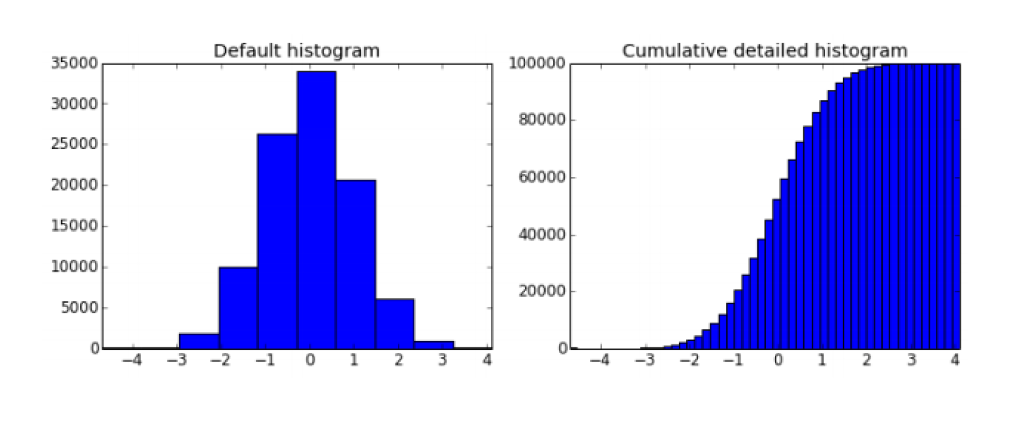
Create Histogram and Cumulative Histogram graph in Python, the graphs must be identical to the pictures.
area (m2) volume (m3)
Step by Step Solution
There are 3 Steps involved in it
1 Expert Approved Answer
Step: 1 Unlock

Question Has Been Solved by an Expert!
Get step-by-step solutions from verified subject matter experts
Step: 2 Unlock
Step: 3 Unlock