

Question: Python help! I need help creating a plot from an excel data sheet. I included a screenshot of what i have done for the project
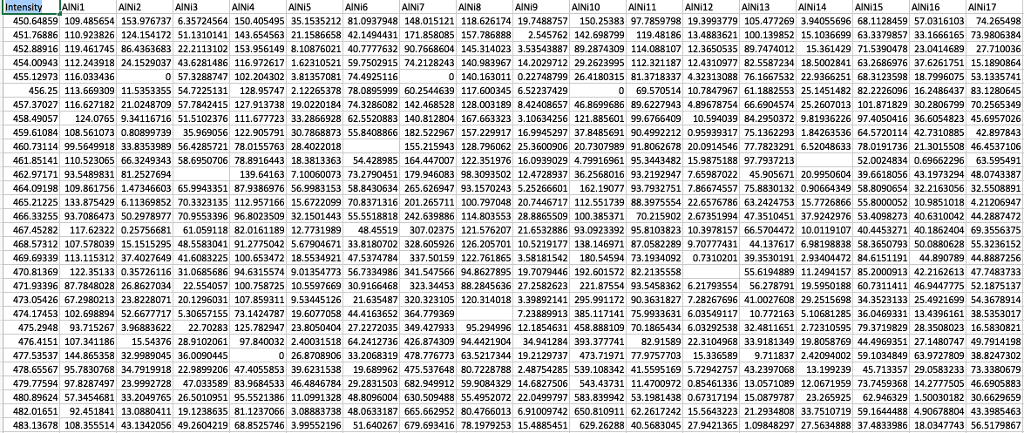
Python help! I need help creating a plot from an excel data sheet. I included a screenshot of what i have done for the project so far and the data table. Each line shows the XRD data of all the materials given a specific Intensity (Arb. Units). AlNi* are the name of the materials. Each column shows the XRD data of one material.
QUESTION: plot the XRD data of the material named AlNi5(missing value can be regarded as 0). Use plt.savefig() function
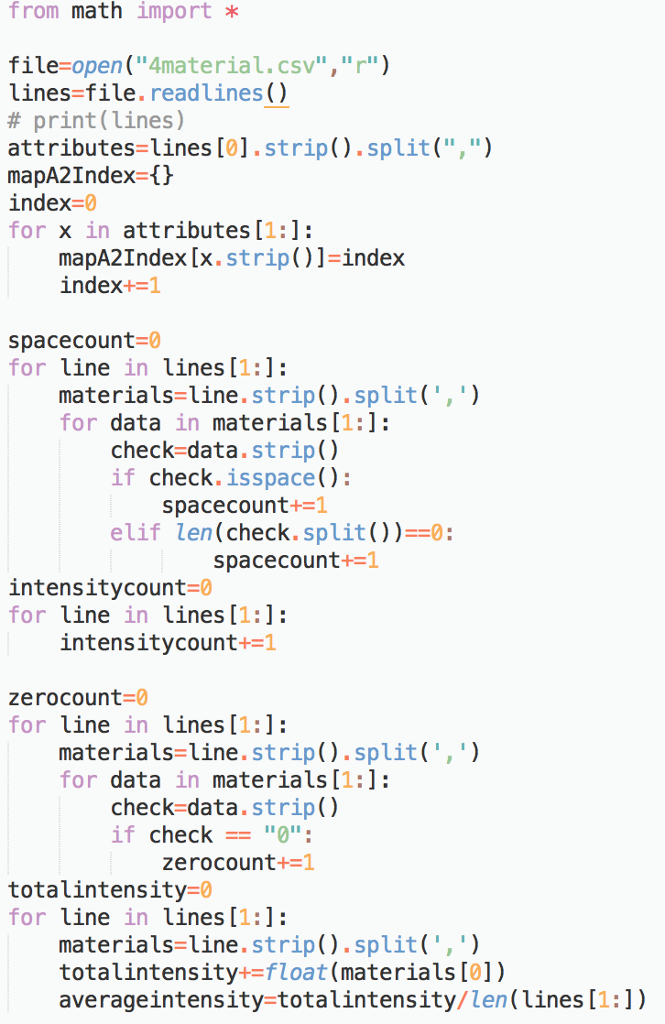
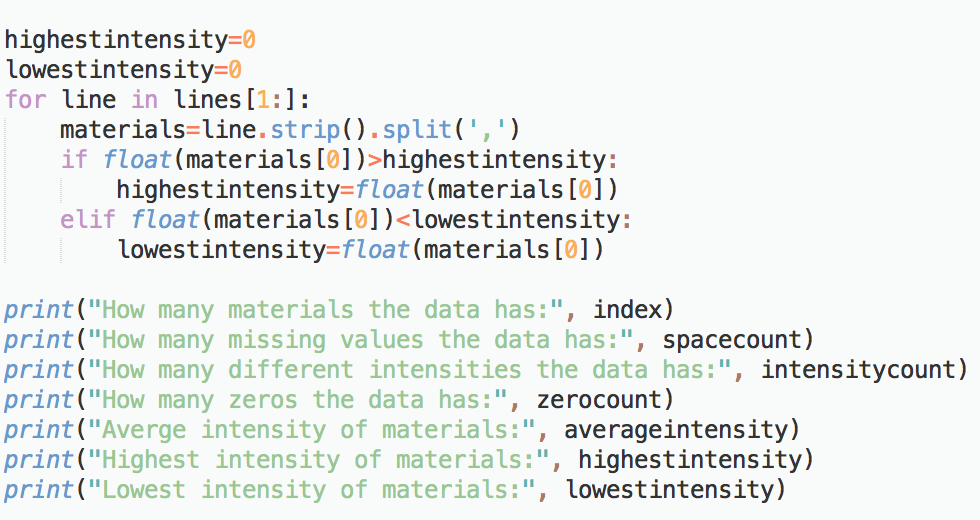
from math import * file-open("4material.csv", "r") lines-file readlines) # print (lines) attributes-lines [0].strip().split(",") mapA2Index-th index-0 for x in attributes [1:]: mapA2Index [x.strip()]-index index+-1 spacecount-0 for Line in Lines LL1 materials-line.strip).split(',') for data in materials [1:]: check-data.strip() if check.isspace(): spacecount+1 elif len(check.split))0 spacecount+1 intensitycount-0 for line in lines [1:] intensitycount+1 zerocount-0 for line in lines [1:] materials-line, strip( ) . split(' , ? ) for data in materials [1:]: check-data.strip() if check 0: zerocount+-1 totalintensity-0 for line in lines [1:: materials-Line, strip( ) . split(' ' totalintensity+-float (materials [0]) averageintensity-totalintensity/len(lines [1:])
Step by Step Solution
There are 3 Steps involved in it

Get step-by-step solutions from verified subject matter experts