

Question: python help me plot my code im trying to do a subplot (one that has the trapezoidal integral graph and the other that have the
python 
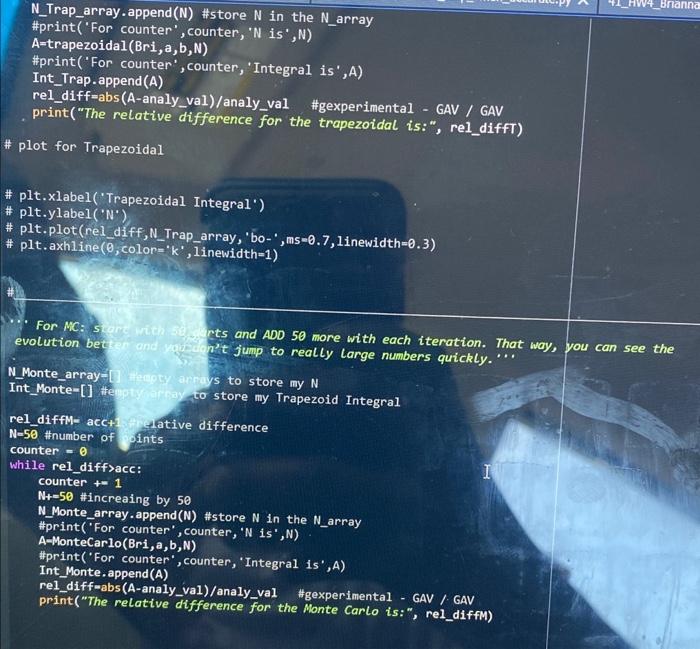
help me plot my code
im trying to do a subplot (one that has the trapezoidal integral graph and the other that have the monte carlo integral graph.
both monte and trapzoidal have functions that find the function.
please help me and also my loop for monte dont stop. do u know a way to stop it ?
MonteCarlo(func, xi,xf,n) : x=np.linspace(xi,xf,n) y-func (x)# Analytical value of this in [5,5] 1s -38.74 . ymin=min(y) if min(y)> : ymin=0 ymax=max(y) if max(y)Br1(xHC[1]) : in area --1 elif Bri(xAK[1])>0 and yMC[1]> and yMC[1]
Step by Step Solution
There are 3 Steps involved in it
1 Expert Approved Answer
Step: 1 Unlock

Question Has Been Solved by an Expert!
Get step-by-step solutions from verified subject matter experts
Step: 2 Unlock
Step: 3 Unlock