

Question: Python I was advise to use cross_val_score helper function, which will automatically deploy the model, perform cross-validation test, and collect scores and for the p-value,
Python
I was advise to use cross_val_score helper function, which will automatically deploy the model, perform cross-validation test, and collect scores and for the p-value, to use statsmodels.
The Table Below is called muscle1.csv that should be read in to complete the assignment.
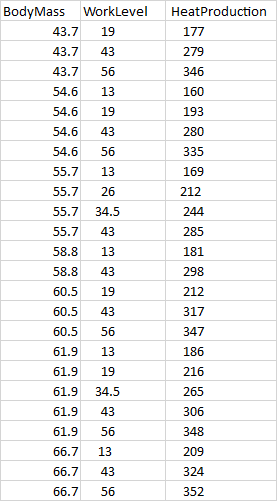
Data Description: Measurements of Heat Production (calories) at various Body Masses (kgs) and Work levels (Calories/hour) on a stationary bike.
Objective: Given a body mass value and a work level, can we predict the heat production through the regression analysis?
Requirements:
1. Read and interpret raw data file correctly.
2. Perform exploratory tests:
a. Do we need to normalized the data?
b. Are there any outliers?
3. Select a proper linear regression model.
a. Train your model.
b. Use 10-fold cross-validation to justify your predicton result
4. Report parameters of your model and find out the p-value of each of your parameter.
5. Report both residual sum of squares (RSS) and residual standard error (RSE).
Body Mass WorkLevel HeatProduction 43.7 19 117 43.7 43 279 43.7 56 346 54.6 13 160 54.6 19 193 54.6 43 280 54.6 56 335 55.7 13 169 55.7 26 212 55.7 34.5 244 55.7 43 285 58.8 13 181 58.8 43 298 60.5 19 212 60.5 43 317 347 60.5 56 61.9 13 186 61.9 19 216 61.9 34.5 265 61.9 43 306 61.9 56 348 66.7 13 209 66.7 43 324 66.7 56 352
Step by Step Solution
There are 3 Steps involved in it

Get step-by-step solutions from verified subject matter experts