

Question: Python Linear regression simulation. Consider the linear regression model Yi = Bo + B12; + i, = i= 1,...,n, where Bo = 5, B =
Python
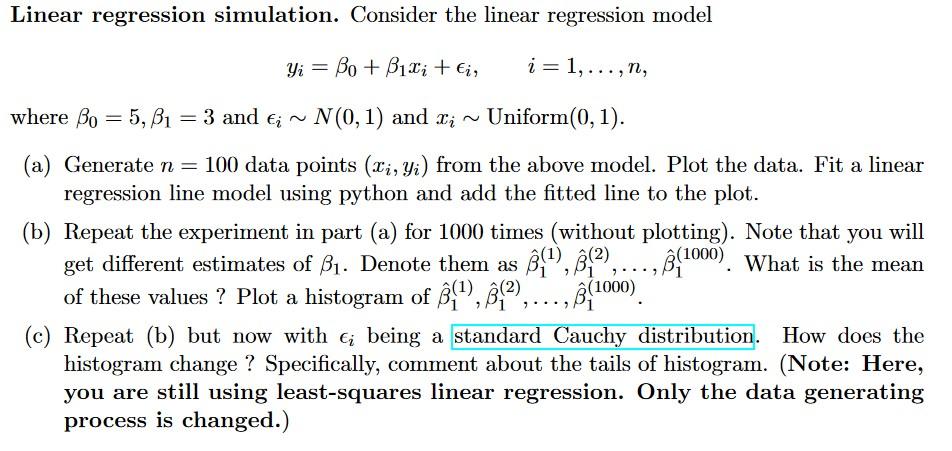
Linear regression simulation. Consider the linear regression model Yi = Bo + B12; + i, = i= 1,...,n, where Bo = 5, B = 3 and ; ~ N(0,1) and xi~ == Uniform(0,1). 7 (a) Generate n= 100 data points (Li, Yi) from the above model. Plot the data. Fit a linear , regression line model using python and add the fitted line to the plot. (b) Repeat the experiment in part (a) for 1000 times (without plotting). Note that you will get different estimates of B1. Denote them as $4), B2),... @(1000). What is the mean A of these values ? Plot a histogram of @?), (2),..., (1) (c) Repeat (b) but now with ei being a standard Cauchy distribution. How does the histogram change ? Specifically, comment about the tails of histogram. (Note: Here, you are still using least-squares linear regression. Only the data generating process is changed.) B(1000) 7
Step by Step Solution
There are 3 Steps involved in it

Get step-by-step solutions from verified subject matter experts