

Question: python Problem 6) Professor Derek is worried about outcomes over time for his age bracket (30-40). He wants you to plot the relative frequency of
python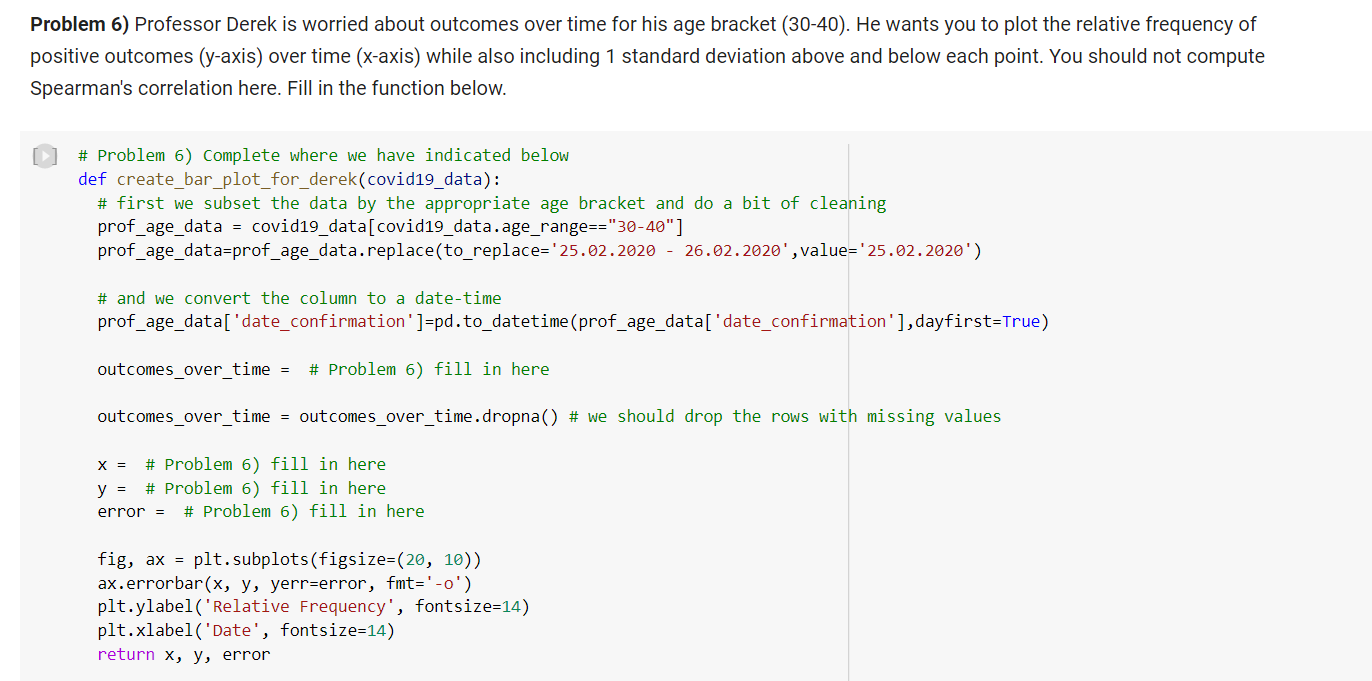
Problem 6) Professor Derek is worried about outcomes over time for his age bracket (30-40). He wants you to plot the relative frequency of Spearman's correlation here. Fill in the function below. [1] \# Problem 6) Complete where we have indicated below def create_bar_plot_for_derek(covid19_data): \# first we subset the data by the appropriate age bracket and do a bit of cleaning prof_age_data = covid19_data[covid19_data.age_range == "30-40"] prof_age_data=prof_age_data.replace(to_replace =25.02.202026.02.2020, value =25.02.2020 ) \# and we convert the column to a date-time prof_age_data['date_confirmation']=pd.to_datetime(prof_age_data['date_confirmation'], dayfirst=True) outcomes_over_time =# Problem 6) fill in here outcomes_over_time = outcomes_over_time.dropna() \# we should drop the rows with missing values x=# Problem 6) fill in here y=# Problem 6) fill in here error = \# Problem 6) fill in here fig, ax= plt. subplots(figsize =(20,10) ) ax. errorbar (x,y, yerr=error, fmt=0) plt.ylabel('Relative Frequency', fontsize=14) plt. xlabel ('Date', fontsize=14) return x,y, error Now let's run our visualization. Problem 6) Professor Derek is worried about outcomes over time for his age bracket (30-40). He wants you to plot the relative frequency of Spearman's correlation here. Fill in the function below. [1] \# Problem 6) Complete where we have indicated below def create_bar_plot_for_derek(covid19_data): \# first we subset the data by the appropriate age bracket and do a bit of cleaning prof_age_data = covid19_data[covid19_data.age_range == "30-40"] prof_age_data=prof_age_data.replace(to_replace =25.02.202026.02.2020, value =25.02.2020 ) \# and we convert the column to a date-time prof_age_data['date_confirmation']=pd.to_datetime(prof_age_data['date_confirmation'], dayfirst=True) outcomes_over_time =# Problem 6) fill in here outcomes_over_time = outcomes_over_time.dropna() \# we should drop the rows with missing values x=# Problem 6) fill in here y=# Problem 6) fill in here error = \# Problem 6) fill in here fig, ax= plt. subplots(figsize =(20,10) ) ax. errorbar (x,y, yerr=error, fmt=0) plt.ylabel('Relative Frequency', fontsize=14) plt. xlabel ('Date', fontsize=14) return x,y, error Now let's run our visualization
Step by Step Solution
There are 3 Steps involved in it

Get step-by-step solutions from verified subject matter experts