

Question: Python Programming: Sokal, R.R. and Rohlf, F.J. (1981) Biometry, 2nd edition, San Francisco: W.H. Freeman, 239. These data relate to air pollution in 21 US
Python Programming:
Sokal, R.R. and Rohlf, F.J. (1981) Biometry, 2nd edition, San Francisco: W.H. Freeman, 239.
These data relate to air pollution in 21 US cities.There is a single dependent variable, theannual mean concentration of sulphur dioxide,in micrograms per cubic meter. These data generally relate to means for the three years1969-71. Thevalues of sixexplanatoryvariablesare also recorded, two of which relate to human ecology, and four to climate. The data were collated by Sokal and Rohlf from several US government publications. Single regression can be used to investigate hypotheses about determinants of pollution. Determine by means of a grid of scatter plots which of these variables may be positively correlated and verify your claim using the R square. Choose the two variables with the highest correlations and build the model. What are the slope (tangent of the inclination) and the intersect of the line with the vertical axis of the Cartesian graph? Show the best fitted line. Hint: you may have to generate a .csv file using MS Excel and then read it as a data frame using the pd.read_csv() function.
The variables are as follows:
y SO2 content of air in micrograms per cubic meter
X1 Average annual temperature in 'F
X2 Number of manufacturing enterprises employing 20 or more workers
X3 Population size (1970 census); in thousands X4 Average annual wind speed in miles per hour
X5 Average annual precipitation in inches
X6Average number of days with precipitation per year
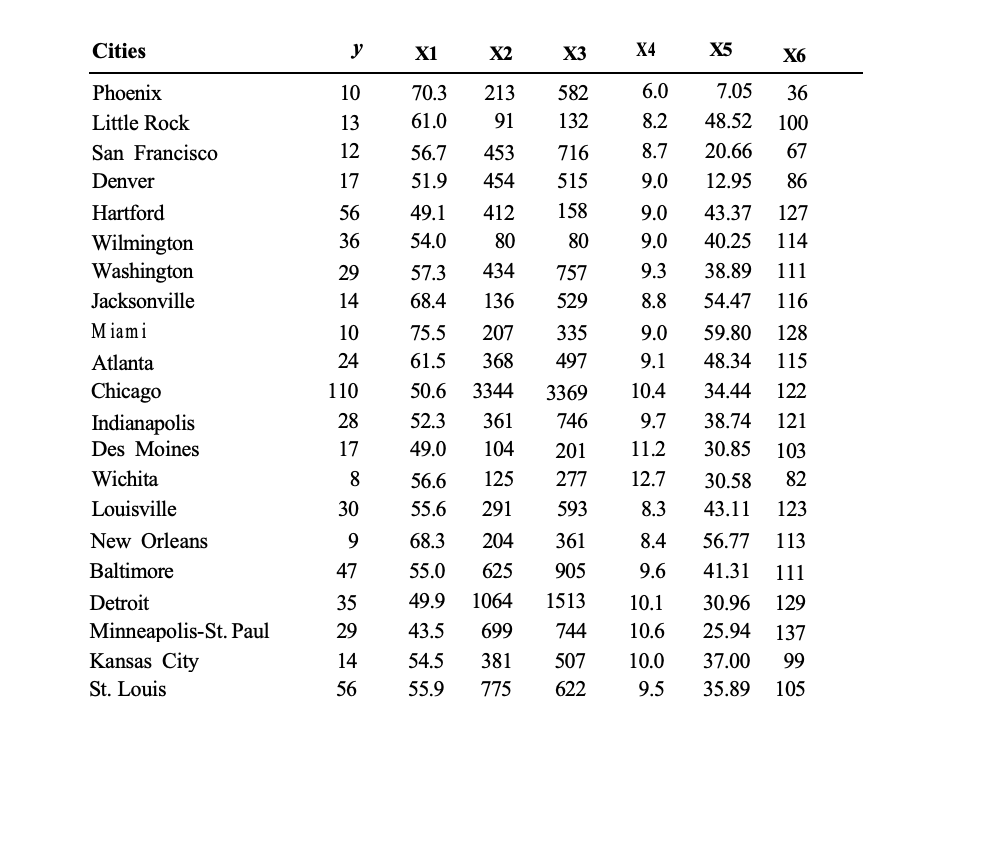
Cities y X1 X2 X3 X4 X5 X6 Phoenix 10 70.3 213 582 6.0 7.05 36 Little Rock 13 61.0 91 132 8.2 48.52 100 San Francisco 12 56.7 453 716 8.7 20.66 67 Denver 17 51.9 454 515 9.0 12.95 86 Hartford 56 49.1 412 158 9.0 43.37 127 Wilmington 36 54.0 80 80 9.0 40.25 114 Washington 29 57.3 434 757 9.3 38.89 111 Jacksonville 14 68.4 136 529 8.8 54.47 116 Miami 10 75.5 207 335 9.0 59.80 128 Atlanta 24 61.5 368 497 9.1 48.34 115 Chicago 110 50.6 3344 3369 10.4 34.44 122 Indianapolis 28 52.3 361 746 9.7 38.74 121 Des Moines 17 49.0 104 201 11.2 30.85 103 Wichita 8 56.6 125 277 12.7 30.58 82 Louisville 30 55.6 291 593 8.3 43.11 123 New Orleans 9 68.3 204 361 8.4 56.77 113 Baltimore 47 55.0 625 905 9.6 41.31 111 Detroit 35 49.9 1064 1513 10.1 30.96 129 Minneapolis-St. Paul 29 43.5 699 744 10.6 25.94 137 Kansas City 14 54.5 381 507 10.0 37.00 99 St. Louis 56 55.9 775 622 9.5 35.89 105
Step by Step Solution
There are 3 Steps involved in it

Get step-by-step solutions from verified subject matter experts