

Question: Q 2 . Try the above with matplotlib ( download iris data from sklearn.datasets import load _ iris ) Q 1 . Use the iris
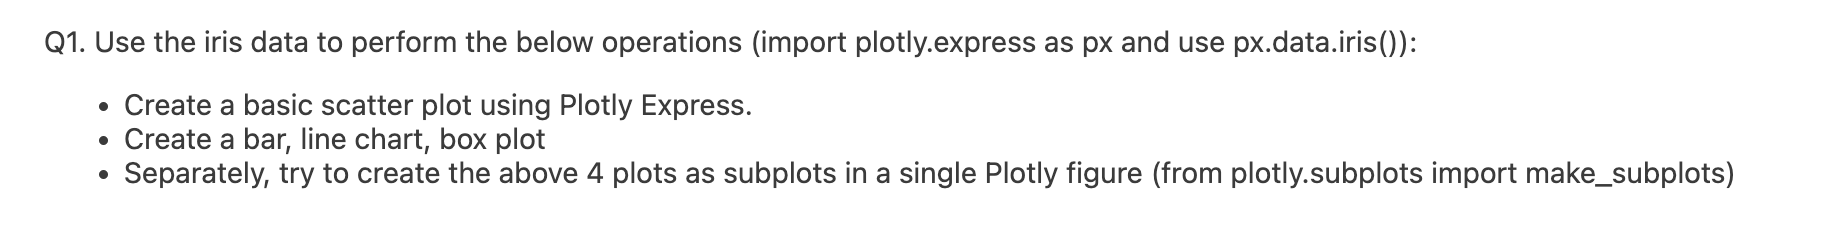
Q Try the above with matplotlib download iris data "from sklearn.datasets import loadiris"Q Use the iris data to perform the below operations import plotly.express as and use pxdata.iris:
Create a basic scatter plot using Plotly Express.
Create a bar, line chart, box plot
Separately, try to create the above plots as subplots in a single Plotly figure from plotly.subplots import makesubplots
Step by Step Solution
There are 3 Steps involved in it
1 Expert Approved Answer
Step: 1 Unlock

Question Has Been Solved by an Expert!
Get step-by-step solutions from verified subject matter experts
Step: 2 Unlock
Step: 3 Unlock