

Question: Q 3 ) a ) Using the data in Table 4 , draw the graph of maximum and minimum bounds of possible weekly cash flow
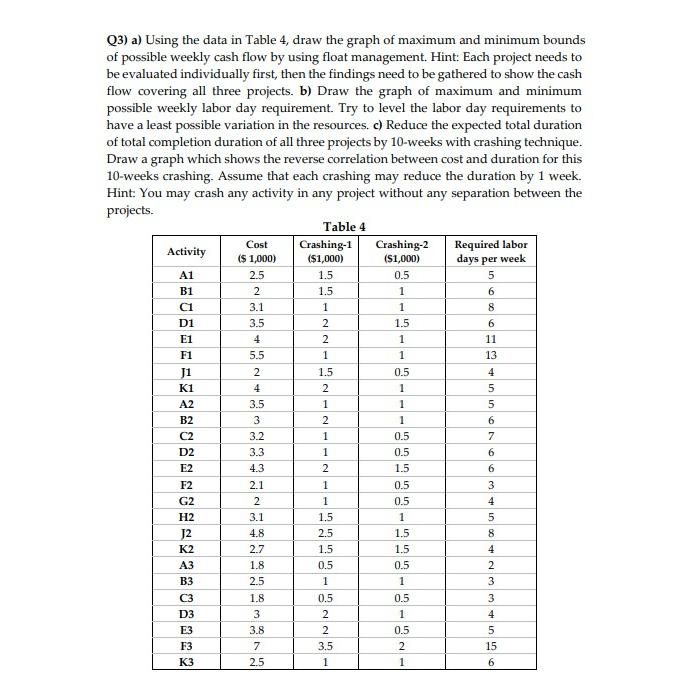
Q a Using the data in Table draw the graph of maximum and minimum bounds of possible weekly cash flow by using float management. Hint: Each project needs to be evaluated individually first, then the findings need to be gathered to show the cash flow covering all three projects. b Draw the graph of maximum and minimum possible weekly labor day requirement. Try to level the labor day requirements to have a least possible variation in the resources. c Reduce the expected total duration of total completion duration of all three projects by weeks with crashing technique. Draw a graph which shows the reverse correlation between cost and duration for this weeks crashing. Assume that each crashing may reduce the duration by week. Hint: You may crash any activity in any project without any separation between the projects.
Table
tableActivitytableCost$
Step by Step Solution
There are 3 Steps involved in it
1 Expert Approved Answer
Step: 1 Unlock

Question Has Been Solved by an Expert!
Get step-by-step solutions from verified subject matter experts
Step: 2 Unlock
Step: 3 Unlock