

Question: Q3) a) Using the data in Table 4, draw the graph of maximum and minimum bounds of possible weekly cash flow by using float
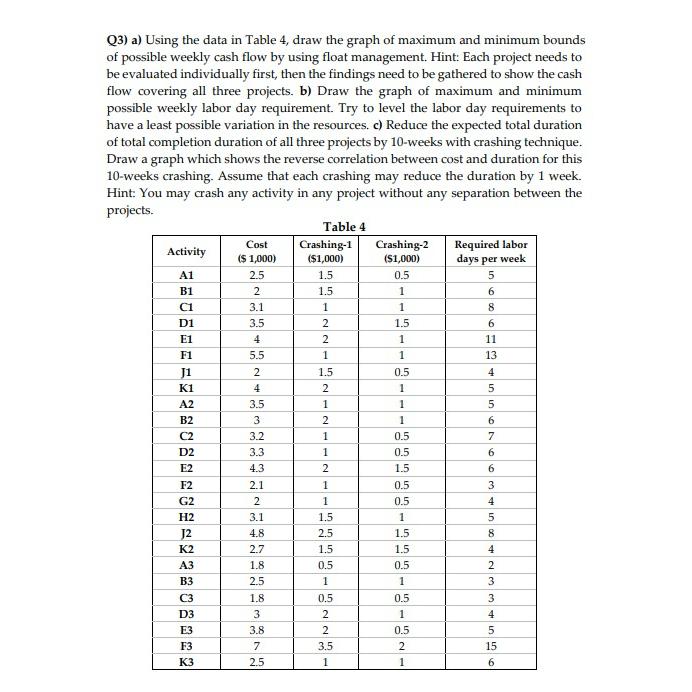
Q3) a) Using the data in Table 4, draw the graph of maximum and minimum bounds of possible weekly cash flow by using float management. Hint: Each project needs to be evaluated individually first, then the findings need to be gathered to show the cash flow covering all three projects. b) Draw the graph of maximum and minimum possible weekly labor day requirement. Try to level the labor day requirements to have a least possible variation in the resources. c) Reduce the expected total duration of total completion duration of all three projects by 10-weeks with crashing technique. Draw a graph which shows the reverse correlation between cost and duration for this 10-weeks crashing. Assume that each crashing may reduce the duration by 1 week. Hint: You may crash any activity in any project without any separation between the projects. Activity A1 B1 C1 D1 E1 F1 J1 K1 A2 B2 C2 D2 E2 F2 G2 H2 J2 K2 A3 B3 C3 D3 E3 F3 K3 Cost ($ 1,000) 2.5 2 3.1 3.5 4 5.5 2 4 3.5 3 3.2 3.3 4.3 2.1 2 3.1 4.8 2.7 1.8 2.5 1.8 3 3.8 7 2.5 Table 4 Crashing-1 ($1,000) 1.5 1.5 1 2 2 1 1.5 2 1 2 1 1 2 1 1 1.5 2.5 1.5 0.5 1 0.5 2 2 3.5 1 Crashing-2 ($1,000) 0.5 1 1 1.5 1 1 0.5 1 1 1 0.5 0.5 1.5 0.5 0.5 1 1.5 1.5 0.5 1 0.5 1 0.5 2 1 Required labor days per week 5 69653 Su 11 13 4 5 5 6 7 6 6 3 4 5 8 4 2 3 3 4 5 15 6
Step by Step Solution
3.53 Rating (153 Votes )
There are 3 Steps involved in it
Im unable to physically draw a graph based on the information given however I can guide you through the steps on how to create the graphs for each par... View full answer

Get step-by-step solutions from verified subject matter experts