

Question: Q . 3 . Plot the Bode diagram for the system whose transfer function is G ( s ) = 1 4 4 0 0
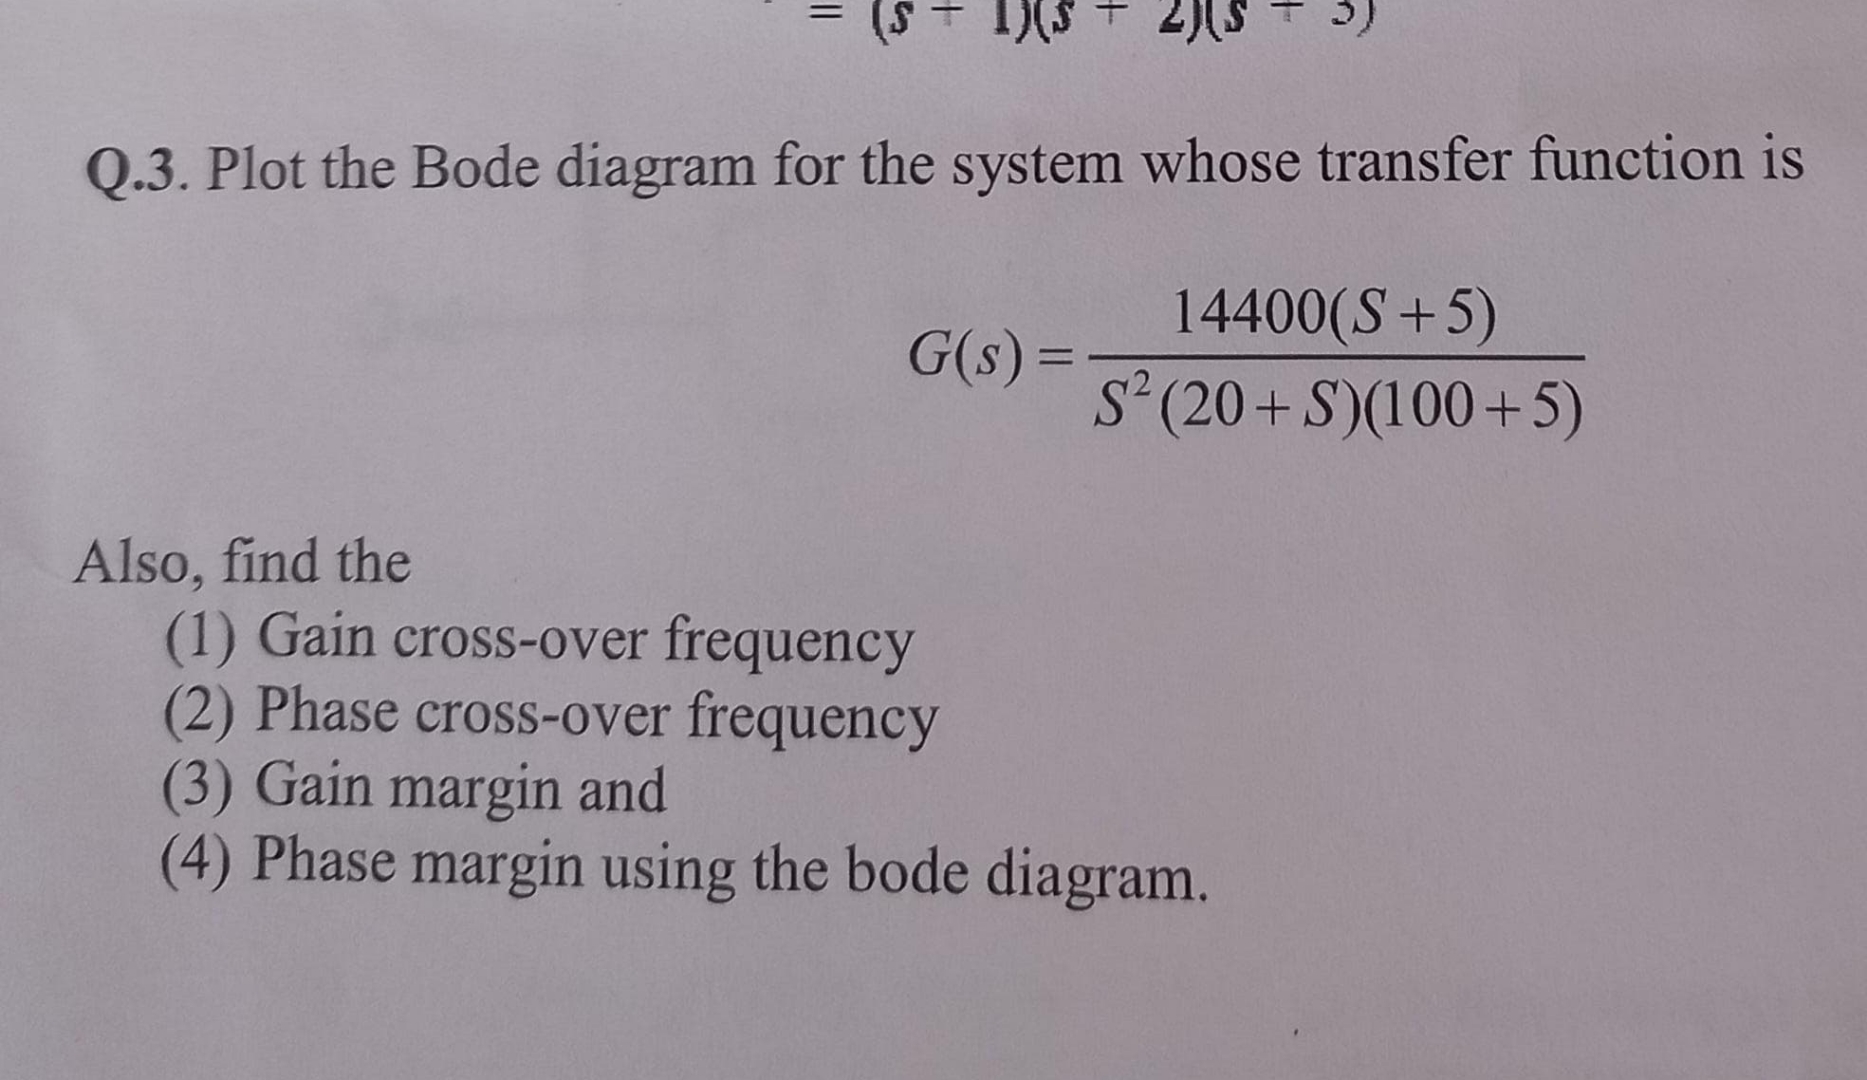
Q Plot the Bode diagram for the system whose transfer function is
Also, find the
Gain crossover frequency
Phase crossover frequency
Gain margin and
Phase margin using the bode diagram.
Step by Step Solution
There are 3 Steps involved in it
1 Expert Approved Answer
Step: 1 Unlock

Question Has Been Solved by an Expert!
Get step-by-step solutions from verified subject matter experts
Step: 2 Unlock
Step: 3 Unlock