

Question: Q 4 ( 8 Marks ) The table in the figure below presents data on scheduled appointments between physicians and patients. Each patient is given
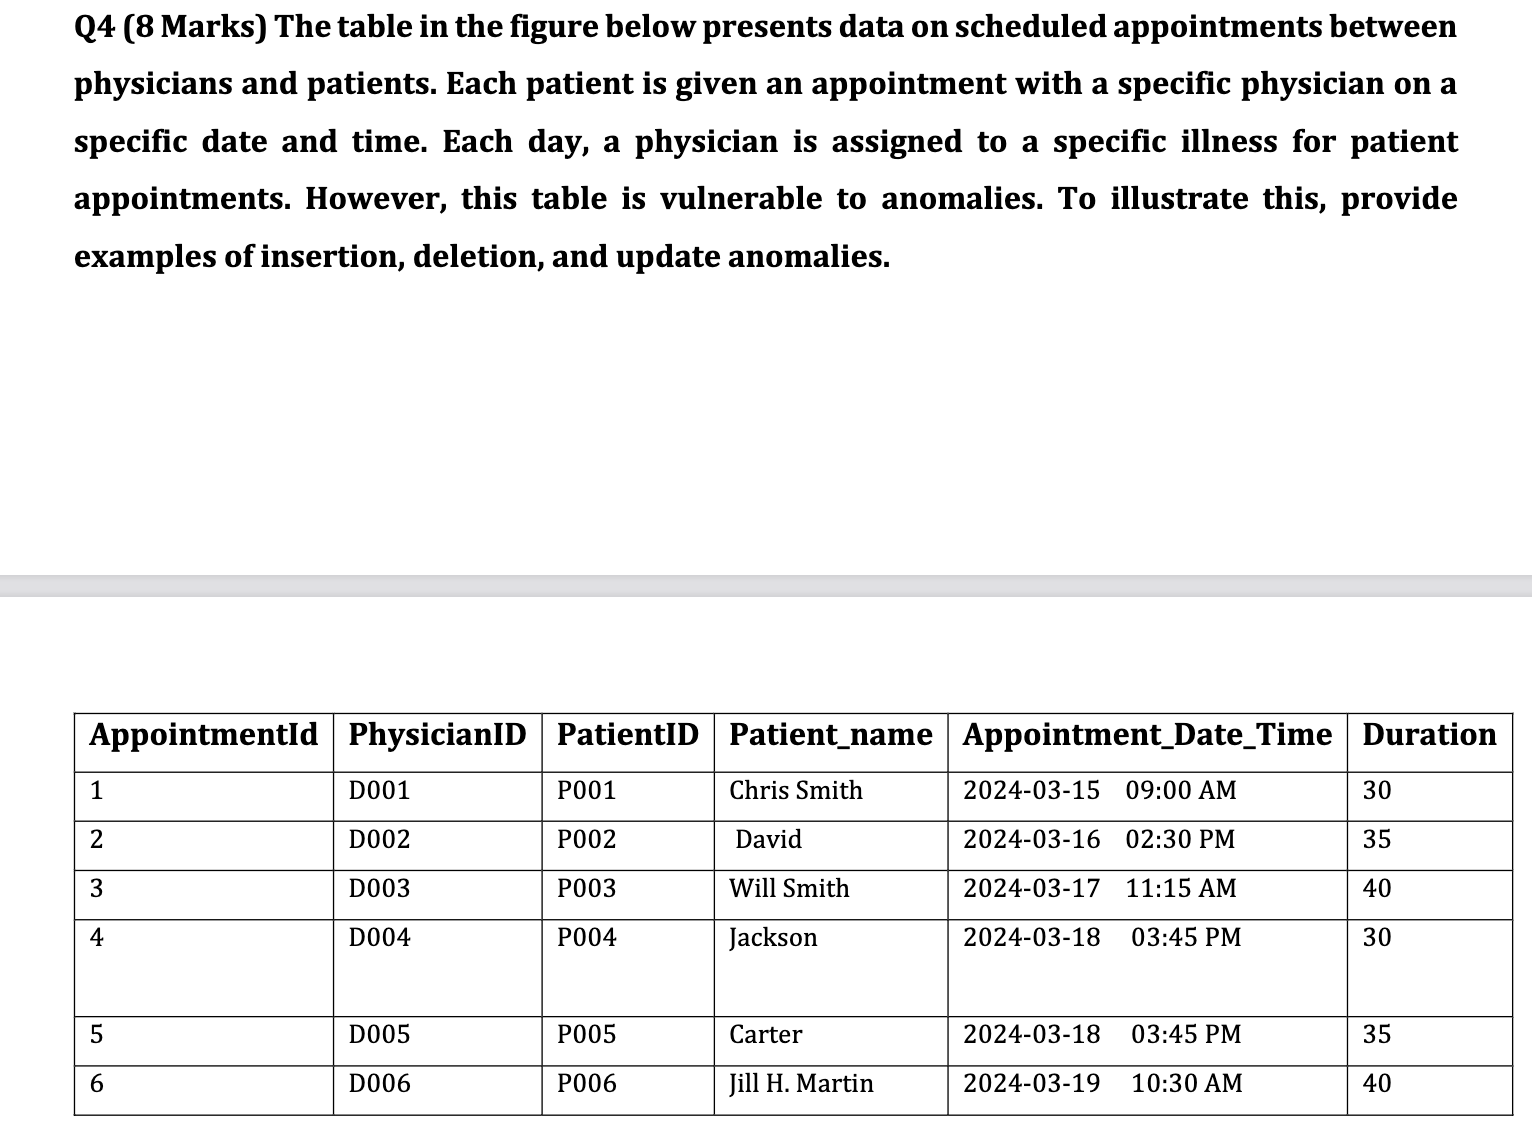
Q Marks The table in the figure below presents data on scheduled appointments between
physicians and patients. Each patient is given an appointment with a specific physician on a
specific date and time. Each day, a physician is assigned to a specific illness for patient
appointments. However, this table is vulnerable to anomalies. To illustrate this, provide
examples of insertion, deletion, and update anomalies.
Step by Step Solution
There are 3 Steps involved in it
1 Expert Approved Answer
Step: 1 Unlock

Question Has Been Solved by an Expert!
Get step-by-step solutions from verified subject matter experts
Step: 2 Unlock
Step: 3 Unlock