

Question: Q 7 : 2 5 pts ) Consider the following dataset that shows the scores of students in standardized exams on reading, writing as well
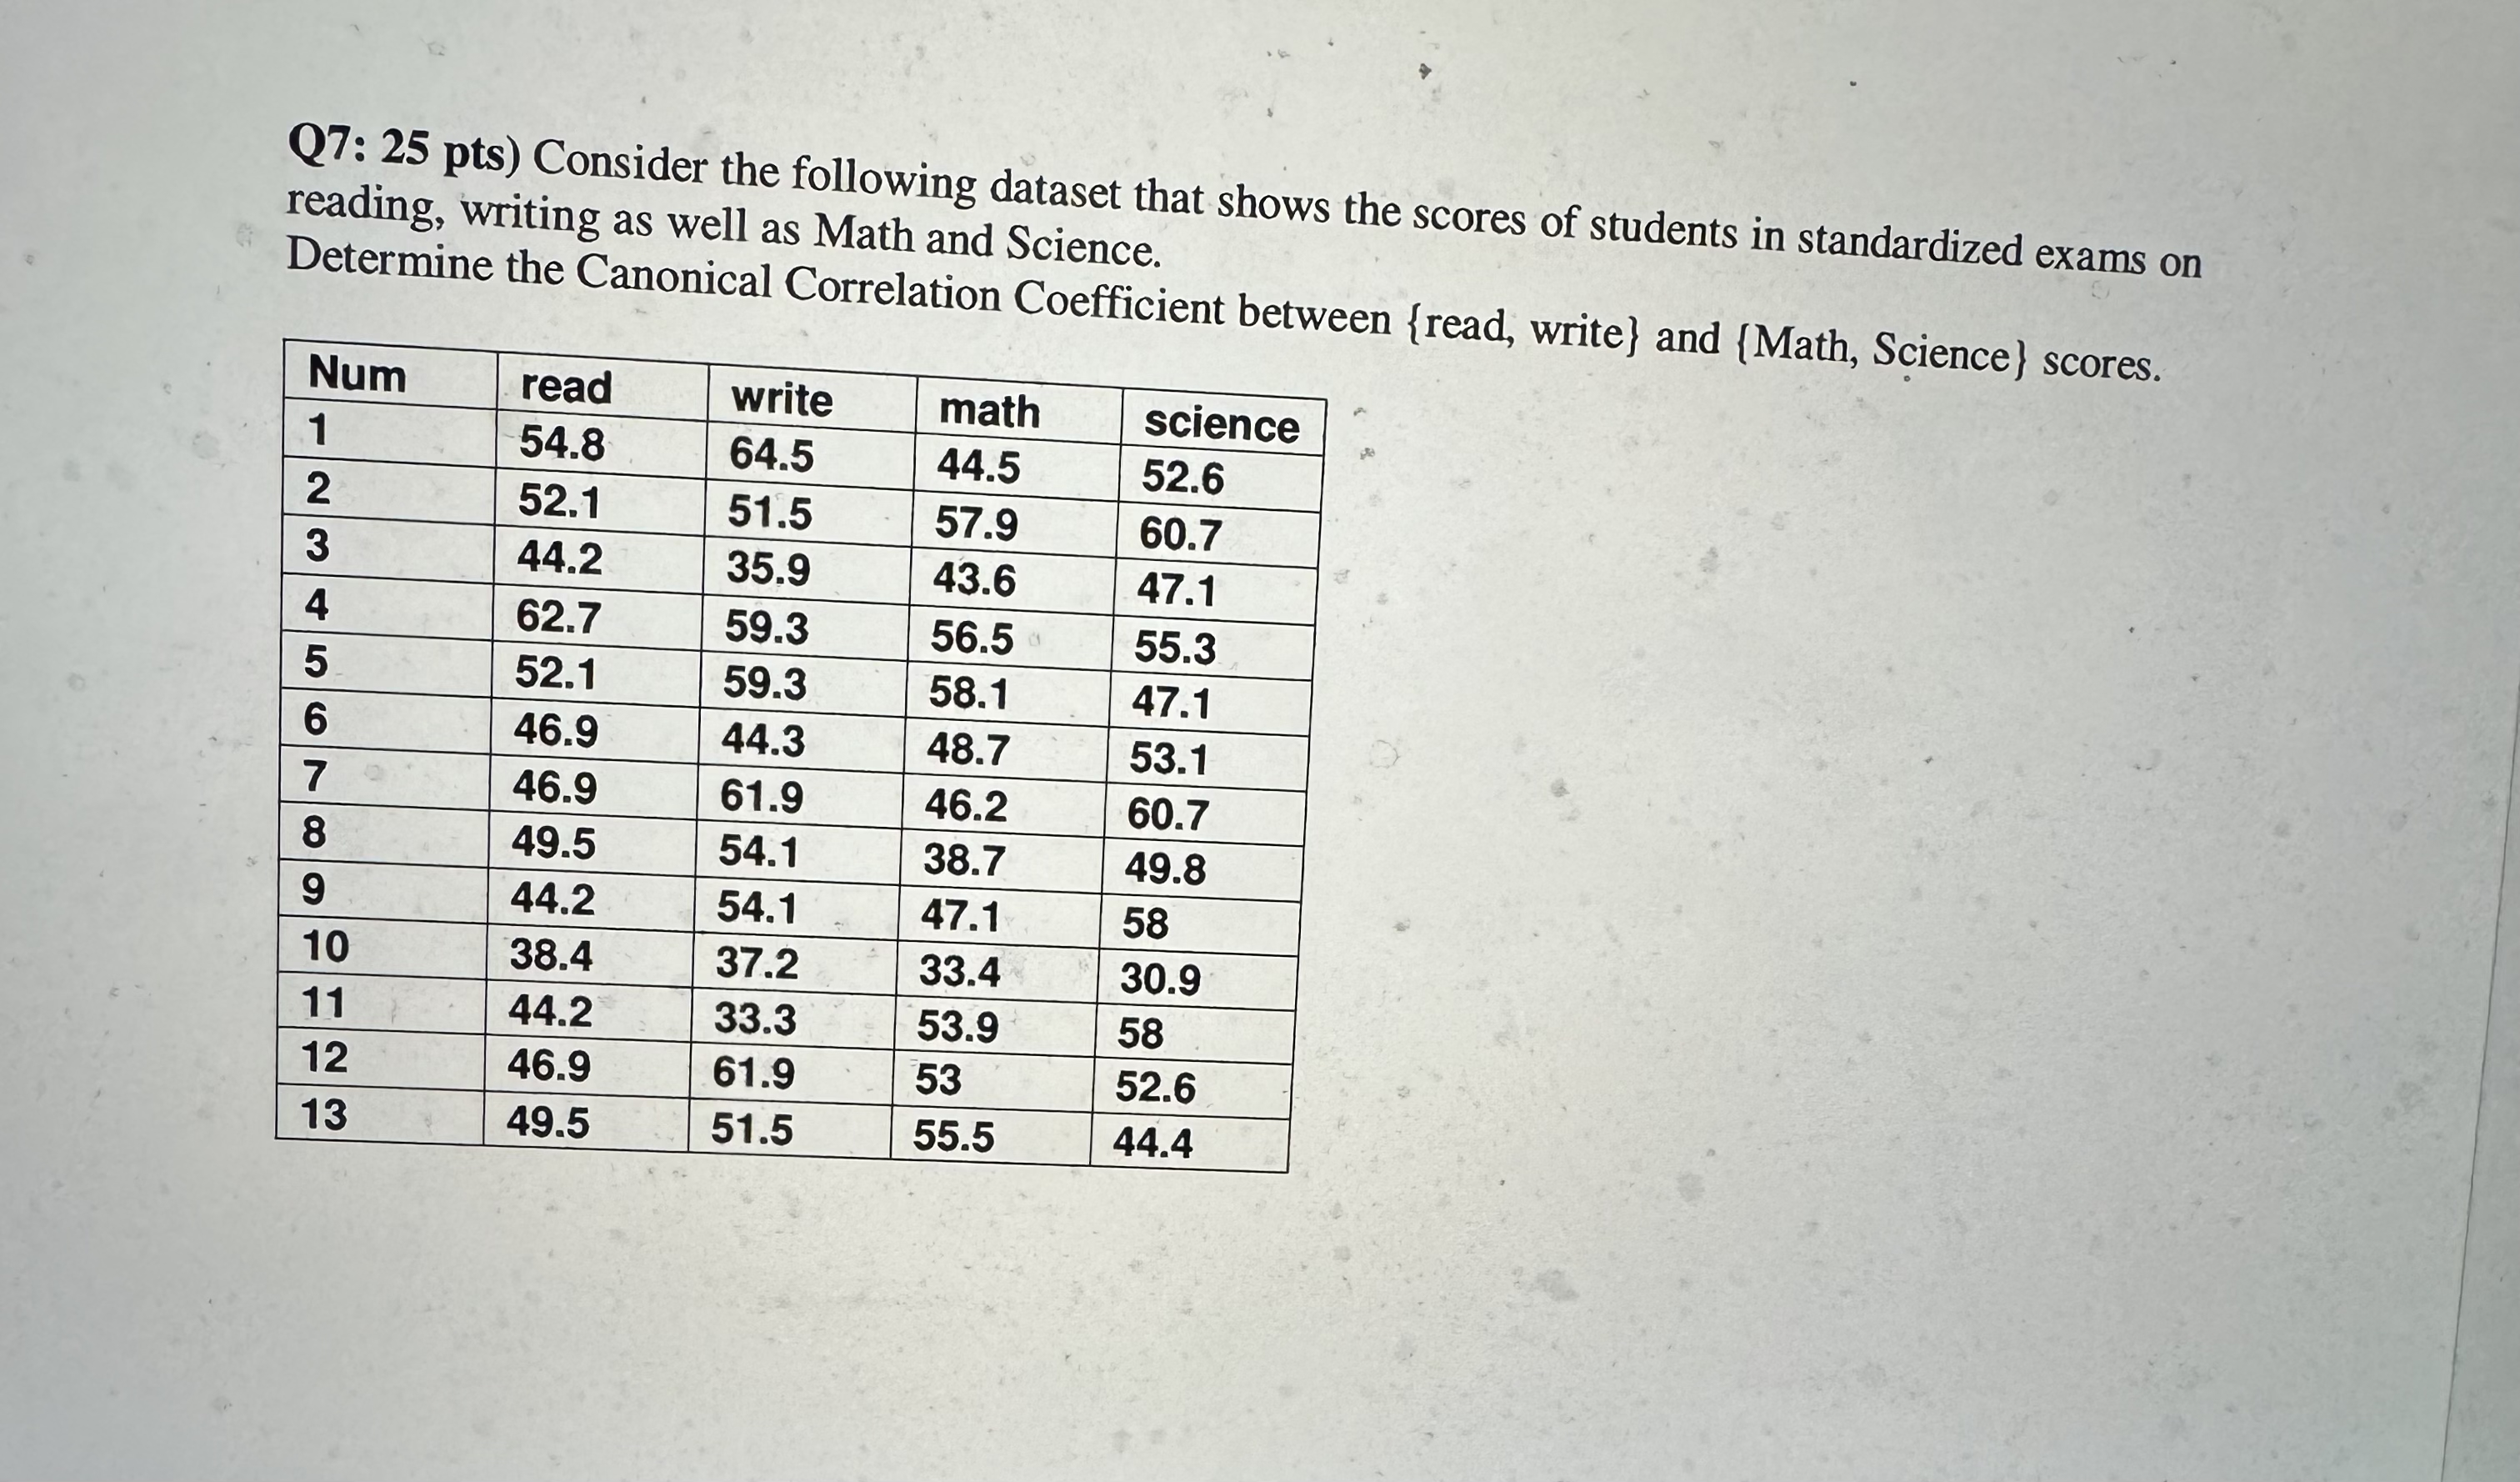
Q: pts Consider the following dataset that shows the scores of students in standardized exams on reading, writing as well as Math and Science.
Determine the Canonical Correlation Coefficient between read write and Math Science scores.
tableNumread,write,math,science
Step by Step Solution
There are 3 Steps involved in it
1 Expert Approved Answer
Step: 1 Unlock

Question Has Been Solved by an Expert!
Get step-by-step solutions from verified subject matter experts
Step: 2 Unlock
Step: 3 Unlock