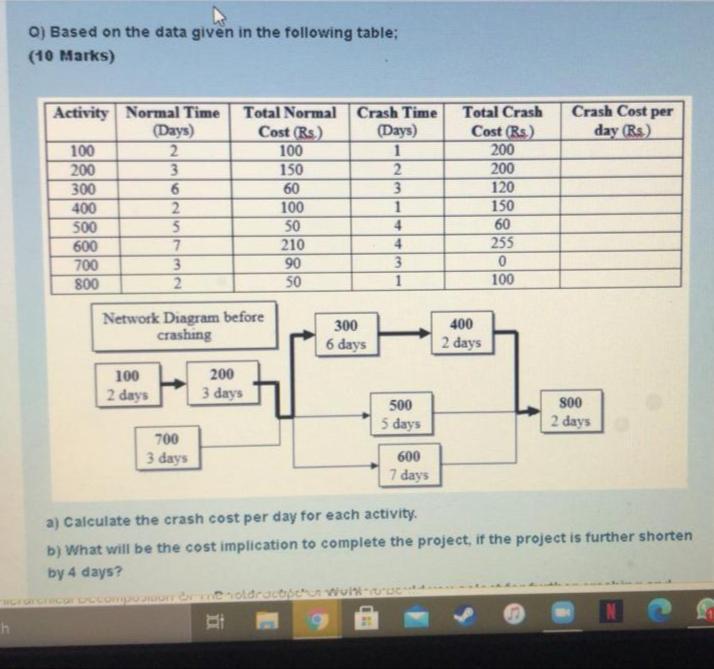
Question: Q) Based on the data given in the following table; (10 Marks) Crash Cost per day (Rs) Activity Normal Time (Days) 100 2 200 3

Q) Based on the data given in the followingQ) Based on the data given in the following

Q) Based on the data given in the following table; (10 Marks) Crash Cost per day (Rs) Activity Normal Time (Days) 100 2 200 3 300 6 400 2 500 5 600 7 700 3 800 2 Total Normal Cost (Rs) 100 150 60 100 50 210 90 50 Crash Time (Days) 1 2 3 1 4 4 3 1 Total Crash Cost (Rs) 200 200 120 150 60 255 0 100 Network Diagram before crashing 300 6 days 400 2 days 100 2 days 200 3 days 500 5 days 800 2 days 700 3 days 600 7 days a) Calculate the crash cost per day for each activity. b) What will be the cost implication to complete the project, if the project is further shorten by 4 days? odrastisch Wort N th 800 Network Diagram before crashing 300 6 days 400 2 days 100 2 days 200 3 days 500 800 5 days 2 days 700 3 days 600 7 days a) Calculate the crash cost per day for each activity. b) What will be the cost implication to complete the project, if the project is further shorten by 4 days? i. Decide which activities would you select for further crashing and give reasons why you have selected those activities for crashing ii. Make new Network Diagram (after crashing) and indicate critical path iii. Give the new total crash cost for each activity iv. What has happened to the total cost of the project

Step by Step Solution

There are 3 Steps involved in it

1 Expert Approved Answer
Step: 1 Unlock blur-text-image
Question Has Been Solved by an Expert!

Get step-by-step solutions from verified subject matter experts

Step: 2 Unlock
Step: 3 Unlock

Students Have Also Explored These Related General Management Questions!