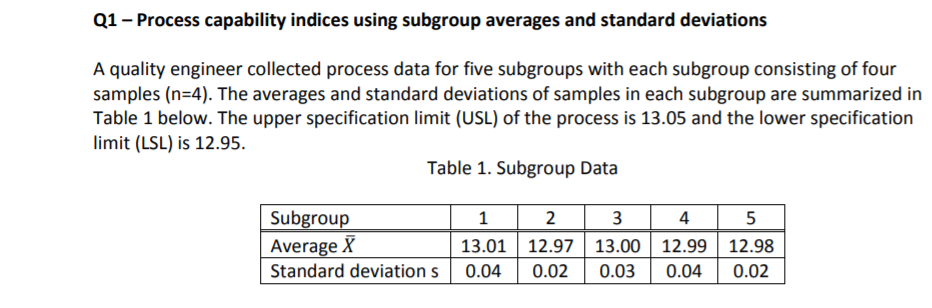
Question: Q1 - Process capability indices using subgroup averages and standard deviations A quality engineer collected process data for five subgroups with each subgroup consisting of

Q1 - Process capability indices using subgroupQ1 - Process capability indices using subgroup

Q1 - Process capability indices using subgroup averages and standard deviations A quality engineer collected process data for five subgroups with each subgroup consisting of four samples (n=4). The averages and standard deviations of samples in each subgroup are summarized in Table 1 below. The upper specification limit (USL) of the process is 13.05 and the lower specification limit (LSL) is 12.95. Table 1. Subgroup Data Subgroup Average X Standard deviations 1 2 3 4 13.01 12.97 13.00 12.99 0.04 0.02 0.03 0.04 5 12.98 0.02 (1-4) Calculate the process capability index Cy. Answer C (1-5) Answer questions in the below table on this process. Answer Is this process capable in terms of C,? Yes or No Briefly explain reason of your above Explain answer (1-6) Calculate the process capability index Cpk | Cpk Answer (1-7) Answer questions in the below table on this process. Answer Is this process capable in terms of Cyk? Yes or No Briefly explain reason of your above Explain

Step by Step Solution

There are 3 Steps involved in it

1 Expert Approved Answer
Step: 1 Unlock blur-text-image
Question Has Been Solved by an Expert!

Get step-by-step solutions from verified subject matter experts

Step: 2 Unlock
Step: 3 Unlock

Students Have Also Explored These Related General Management Questions!