

Question: Q1 X and R chart A quality engineer collected process data for 10 subgroups with each subgroup consisting of four samples (n=4). The averages and
Q1 X and R chart
A quality engineer collected process data for 10 subgroups with each subgroup consisting of four samples (n=4). The averages and ranges of samples in each subgroup are summarized in Table 1 below.
Table 1. Subgroup Data
| Subgroup | 1 | 2 | 3 | 4 | 5 | 6 | 7 | 8 | 9 | 10 |
| Average X | 13.01 | 12.99 | 13.01 | 12.99 | 12.98 | 12.93 | 12.93 | 13.00 | 13.01 | 13.01 |
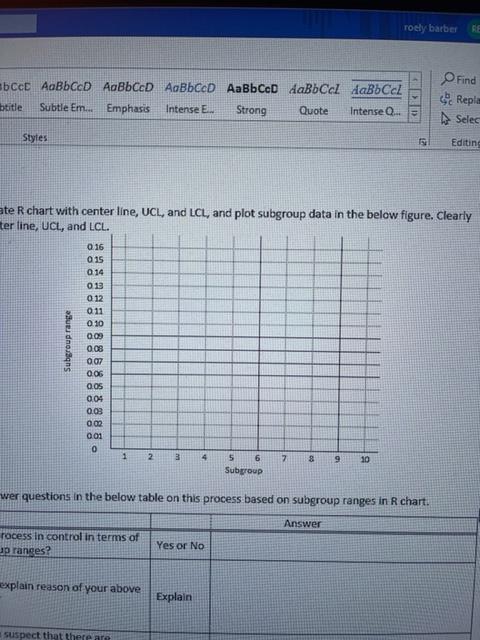
| Range R | 0.06 | 0.04 | 0.03 | 0.05 | 0.04 | 0.06 | 0.07 | 0.03 | 0.04 | 0.06 |
(1-7) Create R chart with center line, UCL, and LCL, and plot subgroup data in the below figure. Clearly label center line, UCL, and LCL.
(1-8) Answer questions in the below table on this process based on subgroup ranges in R chart.
|
|
| Answer |
| Is this process in control in terms of subgroup ranges? | Yes or No |
|
| Briefly explain reason of your above answer | Explain |
|
| Do you suspect that there are variations due to common causes? | Yes or No |
|
| Briefly explain reason of your above answer | Explain |
|
| Do you suspect that there are variations due to assignable causes? | Yes or No |
|
| Briefly explain reason of your above answer | Explain |
|
ate R chart with center line, UCL, and LCL, and plot subgroup data in the below figure. Clearly ter line, UCL, and LCL. wer questions in the below table on this process based on subgroup ranges in R chart
Step by Step Solution
There are 3 Steps involved in it

Get step-by-step solutions from verified subject matter experts