

Question: Q1 X and R chart A quality engineer collected process data for 10 subgroups with each subgroup consisting of four samples (n=4). The averages and
Q1 X and R chart
A quality engineer collected process data for 10 subgroups with each subgroup consisting of four samples (n=4). The averages and ranges of samples in each subgroup are summarized in Table 1 below.
Table 1. Subgroup Data
| Subgroup | 1 | 2 | 3 | 4 | 5 | 6 | 7 | 8 | 9 | 10 |
| Average X | 13.01 | 12.99 | 13.01 | 12.99 | 12.98 | 12.93 | 12.93 | 13.00 | 13.01 | 13.01 |
| Range R | 0.06 | 0.04 | 0.03 | 0.05 | 0.04 | 0.06 | 0.07 | 0.03 | 0.04 | 0.06 |
(1-4) Create X chart with center line, UCL, and LCL, and plot subgroup data in the below figure. Clearly label center line, UCL, and LCL.
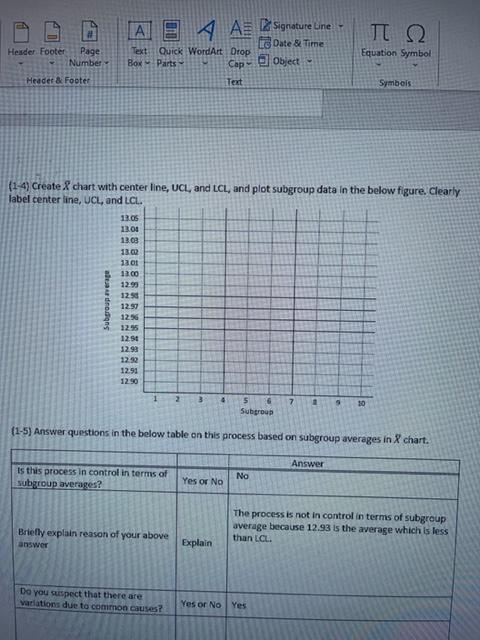
(1-4) Create X chart with center line, UCL, and LCL, and plot subgroup data in the below figure. Clearly label center line, UCL, and LCL. (1-5) Answer questions in the below table on this process based on subgroup averages in P chart
Step by Step Solution
There are 3 Steps involved in it
1 Expert Approved Answer
Step: 1 Unlock

Question Has Been Solved by an Expert!
Get step-by-step solutions from verified subject matter experts
Step: 2 Unlock
Step: 3 Unlock