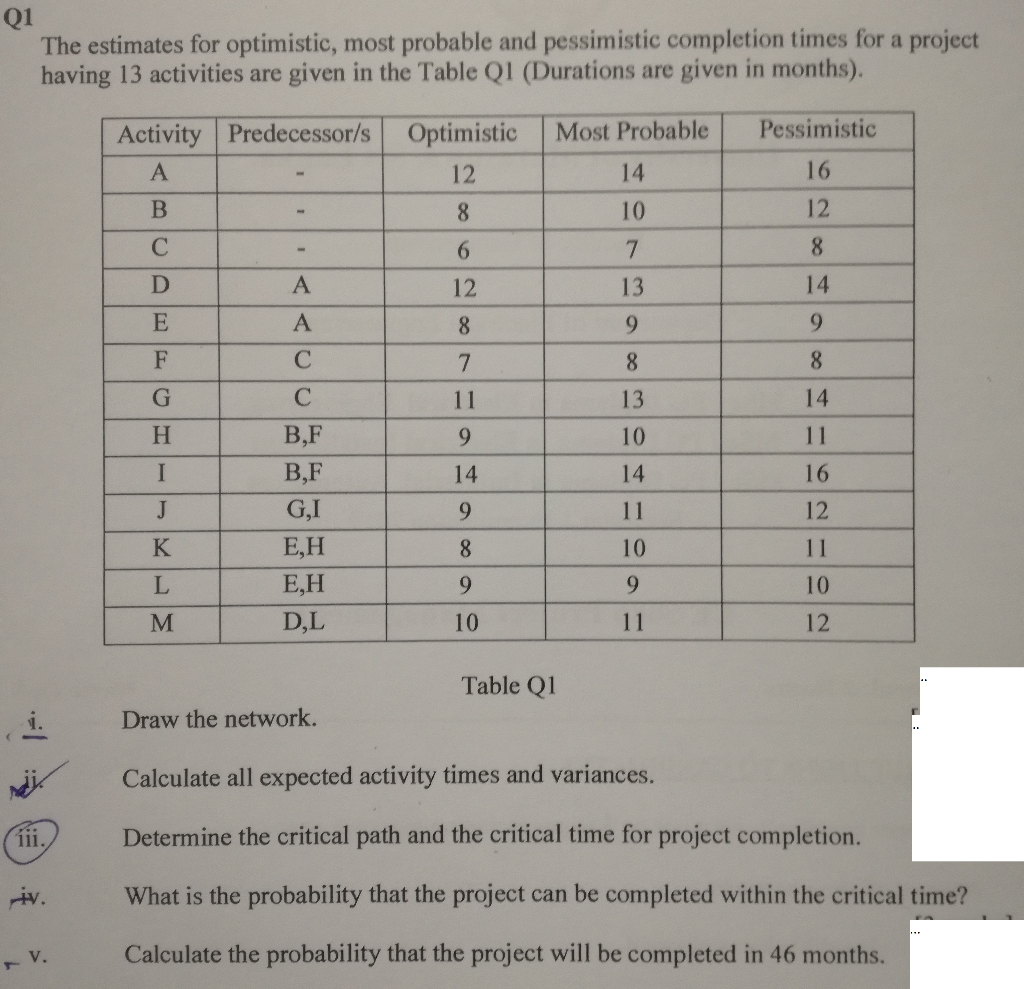
Question: Q1 The estimates for optimistic, most probable and pessimistic completion times for a project having 13 activities are given in the Table Q1 (Durations are

Q1 The estimates for optimistic, most probable

Q1 The estimates for optimistic, most probable and pessimistic completion times for a project having 13 activities are given in the Table Q1 (Durations are given in months). Most Probable Pessimistic Activity Predecessor/s A Optimistic 12 14 16 B 8 12 10 7 6 8 D A 12 13 14 E 8 9 9 A F 7 8 8 G 11 13 14 H B.F 9 10 11 I 14 14 16 9 11 12 J K B,F GI E,H E,H DL 8 10 11 L 9 9 10 M 10 11 12 Table Q1 Draw the network. Calculate all expected activity times and variances. Tii. Determine the critical path and the critical time for project completion. What is the probability that the project can be completed within the critical time? V. Calculate the probability that the project will be completed in 46 months

Step by Step Solution

There are 3 Steps involved in it

1 Expert Approved Answer
Step: 1 Unlock blur-text-image
Question Has Been Solved by an Expert!

Get step-by-step solutions from verified subject matter experts

Step: 2 Unlock
Step: 3 Unlock

Students Have Also Explored These Related General Management Questions!