

Question: Q2 (5 Points) Spreadsheets are useful for computing statistics: averages, standard deviation, variance, and correlation are included as built-in functions. Below is recent monthly
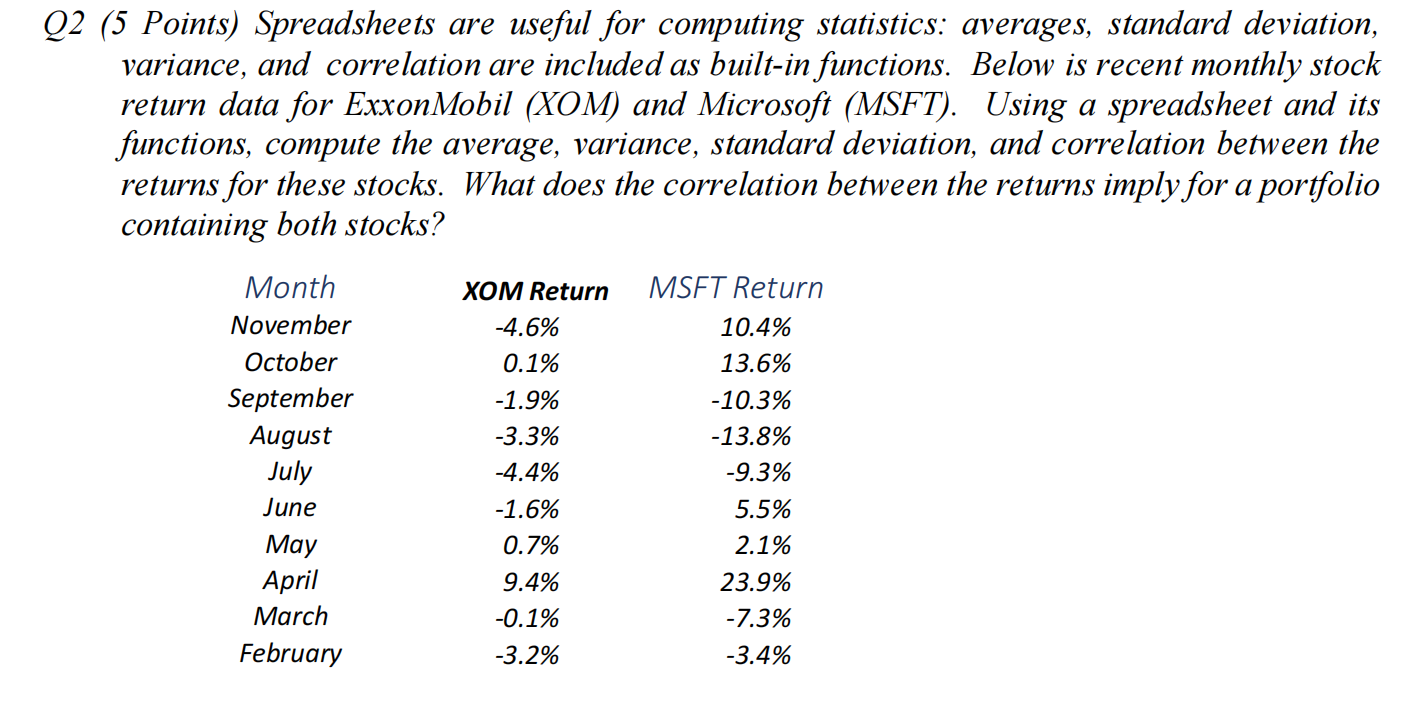
Q2 (5 Points) Spreadsheets are useful for computing statistics: averages, standard deviation, variance, and correlation are included as built-in functions. Below is recent monthly stock return data for ExxonMobil (XOM) and Microsoft (MSFT). Using a spreadsheet and its functions, compute the average, variance, standard deviation, and correlation between the returns for these stocks. What does the correlation between the returns imply for a portfolio containing both stocks? Month XOM Return MSFT Return November -4.6% 10.4% October 0.1% 13.6% September -1.9% -10.3% August -3.3% -13.8% July -4.4% -9.3% June -1.6% 5.5% May 0.7% 2.1% April 9.4% 23.9% March -0.1% -7.3% February -3.2% -3.4%
Step by Step Solution
There are 3 Steps involved in it

Get step-by-step solutions from verified subject matter experts