

Question: Spreadsheets are useful for computing statistics: averages, standard deviation, variance, and correlation are included as built-in functions. Below is recent monthly stock return data fo
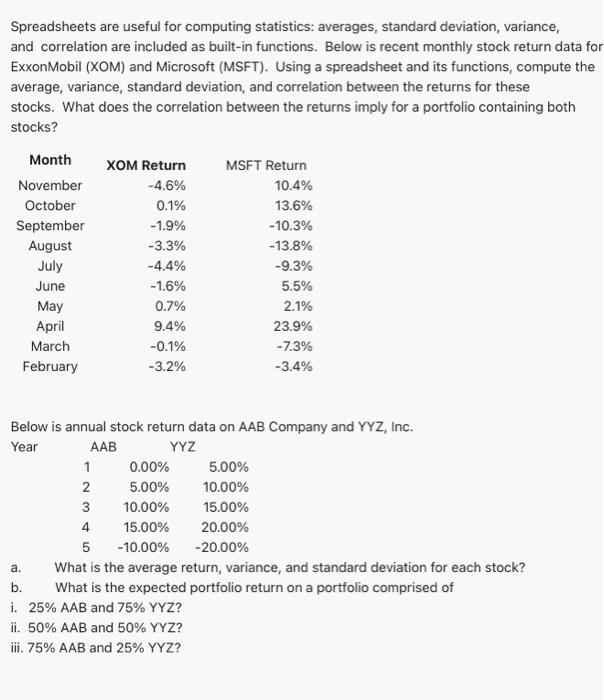
Spreadsheets are useful for computing statistics: averages, standard deviation, variance, and correlation are included as built-in functions. Below is recent monthly stock return data fo ExxonMobil (XOM) and Microsoft (MSFT). Using a spreadsheet and its functions, compute the average, variance, standard deviation, and correlation between the returns for these stocks. What does the correlation between the returns imply for a portfolio containing both stocks? Below is annual stock return data on AAB Company and YYZ, Inc. a. What is the average return, variance, and standard deviation for each stock? b. What is the expected portfolio return on a portfolio comprised of i. 25%AAB and 75% YYZ? ii. 50%AAB and 50% YYZ? iii. 75% AAB and 25% YYZ
Step by Step Solution
There are 3 Steps involved in it

Get step-by-step solutions from verified subject matter experts