

Question: Q2 (a) An open loop response experiment is to be performed on a controller. The following error signal profile is to be used: 2 1
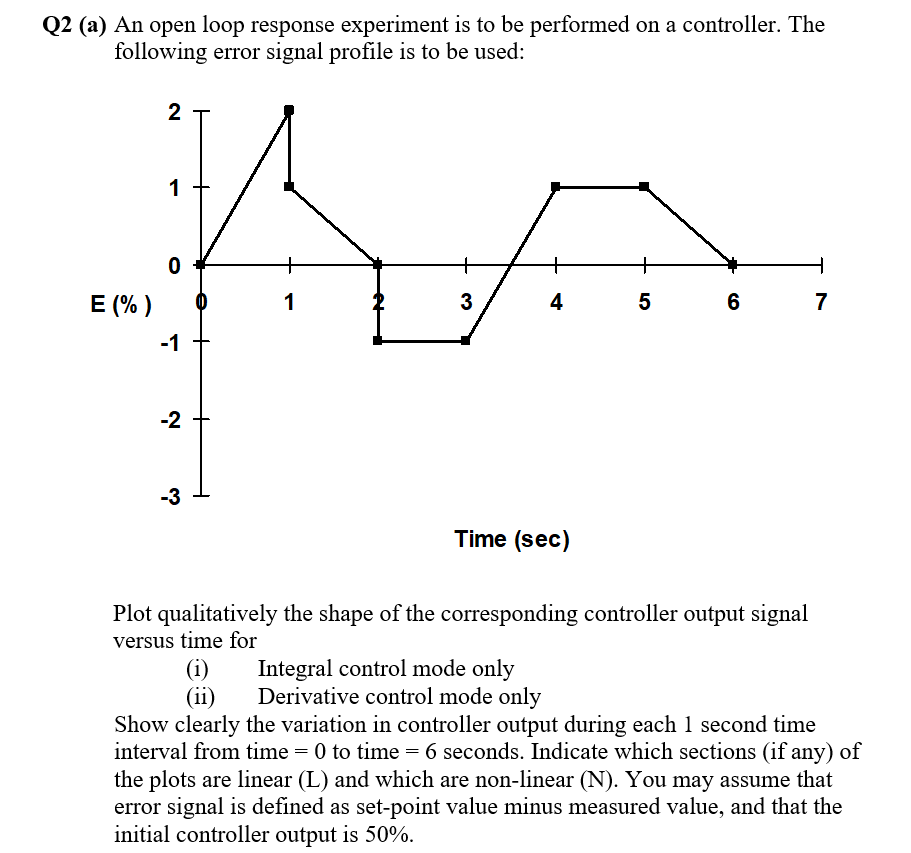
Q2 (a) An open loop response experiment is to be performed on a controller. The following error signal profile is to be used: 2 1 0 E (%) 1 3 4 5 5 6 7 -1 -2 -3 H Time (sec) Plot qualitatively the shape of the corresponding controller output signal versus time for (i) Integral control mode only (ii) Derivative control mode only Show clearly the variation in controller output during each 1 second time interval from time = 0 to time = 6 seconds. Indicate which sections (if any) of the plots are linear (L) and which are non-linear (N). You may assume that error signal is defined as set-point value minus measured value, and that the initial controller output is 50%
Step by Step Solution
There are 3 Steps involved in it

Get step-by-step solutions from verified subject matter experts