

Question: Q2. (b) An open loop response experiment is to be performed on a controller. The following error signal profile is to be used: 2 1
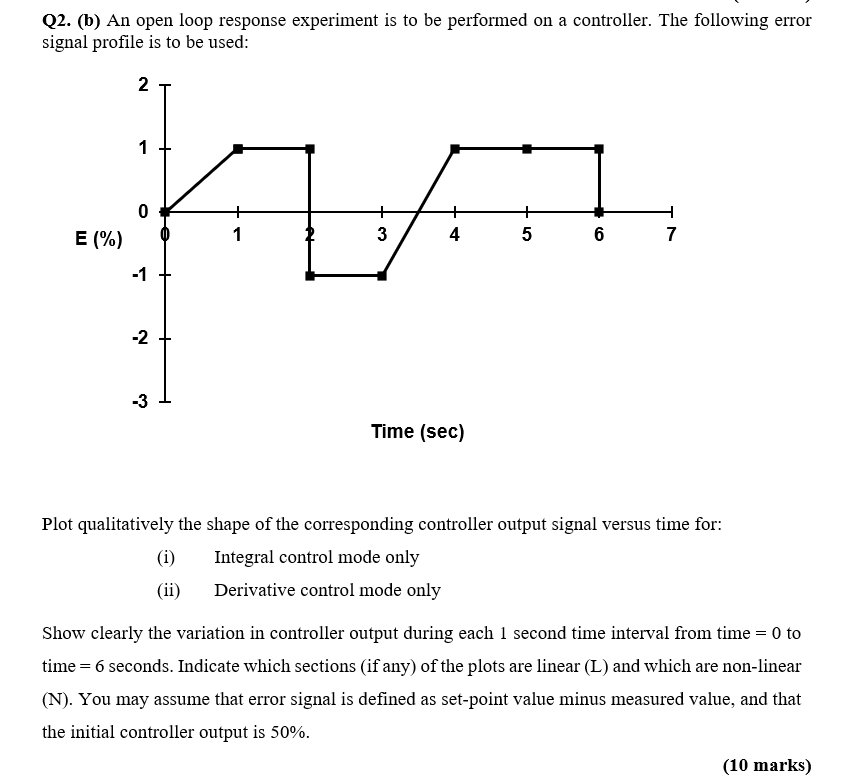
Q2. (b) An open loop response experiment is to be performed on a controller. The following error signal profile is to be used: 2 1 0 + 1 7 E (%) 3 4 5 6 7 -1 -2 -3 Time (sec) Plot qualitatively the shape of the corresponding controller output signal versus time for: (i) Integral control mode only (ii) Derivative control mode only Show clearly the variation in controller output during each 1 second time interval from time = 0 to time = 6 seconds. Indicate which sections (if any) of the plots are linear (L) and which are non-linear (N). You may assume that error signal is defined as set-point value minus measured value, and that the initial controller output is 50%. (10 marks)
Step by Step Solution
There are 3 Steps involved in it

Get step-by-step solutions from verified subject matter experts