

Question: Q.2: The data presented below represents the Triton Sales per share for a period of 10 Years. Year 2000 2001 2002 2003 2004 2005 Sales
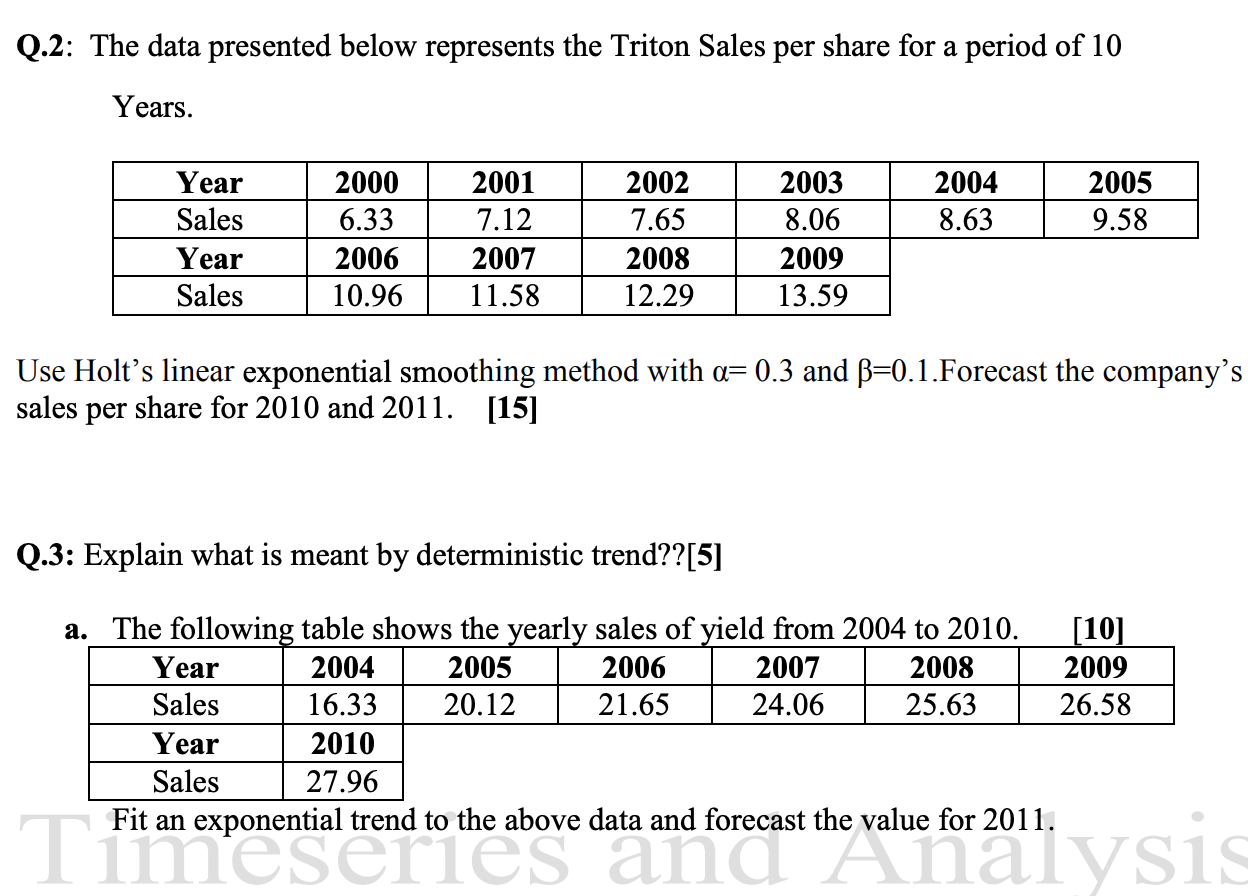
Q.2: The data presented below represents the Triton Sales per share for a period of 10 Years. Year 2000 2001 2002 2003 2004 2005 Sales 6.33 7.12 7.65 8.06 8.63 9.58 Year 2006 2007 2008 2009 Sales 10.96 11.58 12.29 13.59 Use Holt's linear exponential smoothing method with a= 0.3 and B=0.1.Forecast the company's sales per share for 2010 and 2011. [15] Q.3: Explain what is meant by deterministic trend??[5] a. The following table shows the yearly sales of yield from 2004 to 2010. [10] Year 2004 2005 2006 2007 2008 2009 Sales 16.33 20.12 21.65 24.06 25.63 26.58 Year 2010 Sales 27.96 Fit an exponential trend to the above data and forecast the value for 2011. Timeseries and Analysis
Step by Step Solution
There are 3 Steps involved in it

Get step-by-step solutions from verified subject matter experts