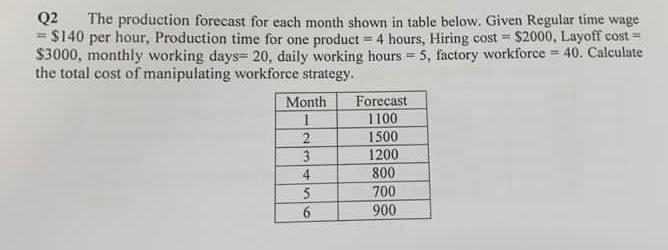
Question: Q2 The production forecast for each month shown in table below, Given Regular time wage = $140 per hour, Production time for one product =

Q2 The production forecast for each month shown
Q2 The production forecast for each month shown in table below, Given Regular time wage = $140 per hour, Production time for one product = 4 hours, Hiring cost = $2000, Layoff cost = $3000, monthly working days=20, daily working hours = 5, factory workforce = 40. Calculate the total cost of manipulating workforce strategy. Month Forecast 1 1100 2 1500 3 1200 4. 800 5 700 6 900

Step by Step Solution

There are 3 Steps involved in it

1 Expert Approved Answer
Step: 1 Unlock blur-text-image
Question Has Been Solved by an Expert!

Get step-by-step solutions from verified subject matter experts

Step: 2 Unlock
Step: 3 Unlock

Students Have Also Explored These Related General Management Questions!