

Question: Q2 The production forecast for each month shown in table below. Given Regular time wage = $140 per hour, Production time for one product
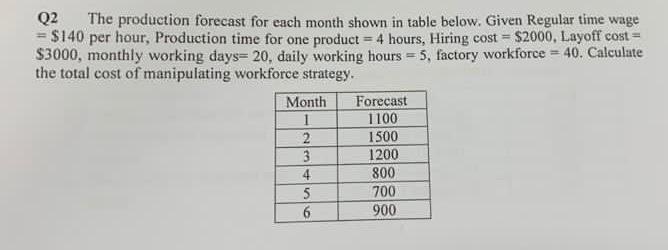
Q2 The production forecast for each month shown in table below. Given Regular time wage = $140 per hour, Production time for one product = 4 hours, Hiring cost = $2000, Layoff cost = $3000, monthly working days= 20, daily working hours = 5, factory workforce = 40. Calculate the total cost of manipulating workforce strategy. Month 1 2 3 4 5 6 Forecast 1100 1500 1200 800 700 900
Step by Step Solution
3.37 Rating (147 Votes )
There are 3 Steps involved in it
Period Forecast 1 2 3 4 5 6 1100 1500 1200 800 700 900 Workers Needed 110025 44 150025 ... View full answer

Get step-by-step solutions from verified subject matter experts